Weekend Metro and V/Line train patronage is booming
Patronage update
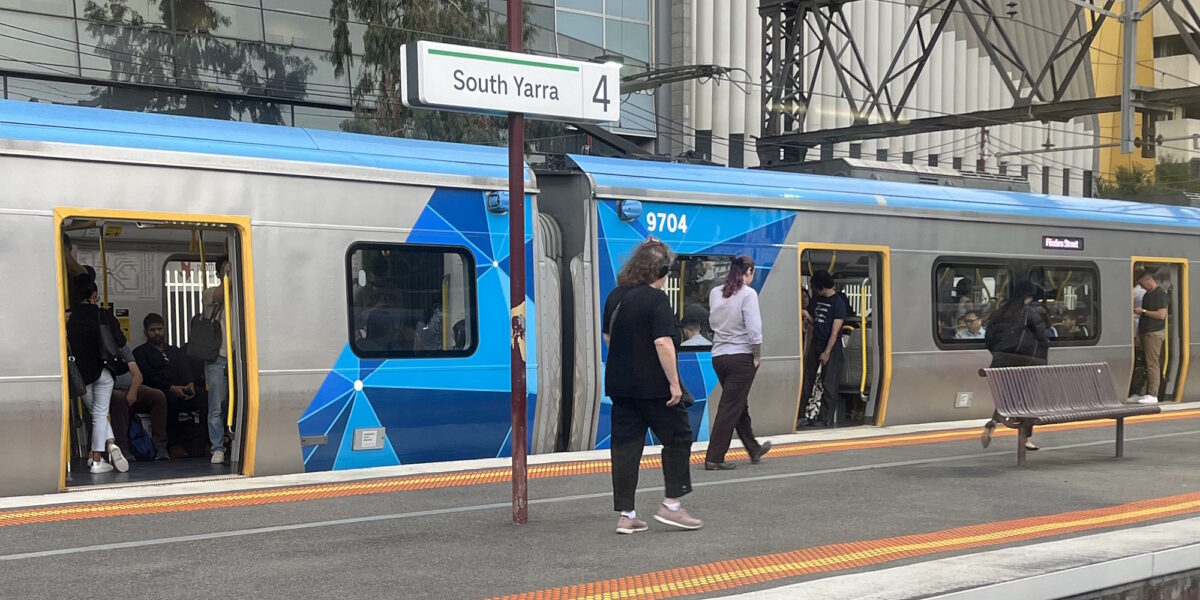

Weekend Metro and V/Line train patronage is booming
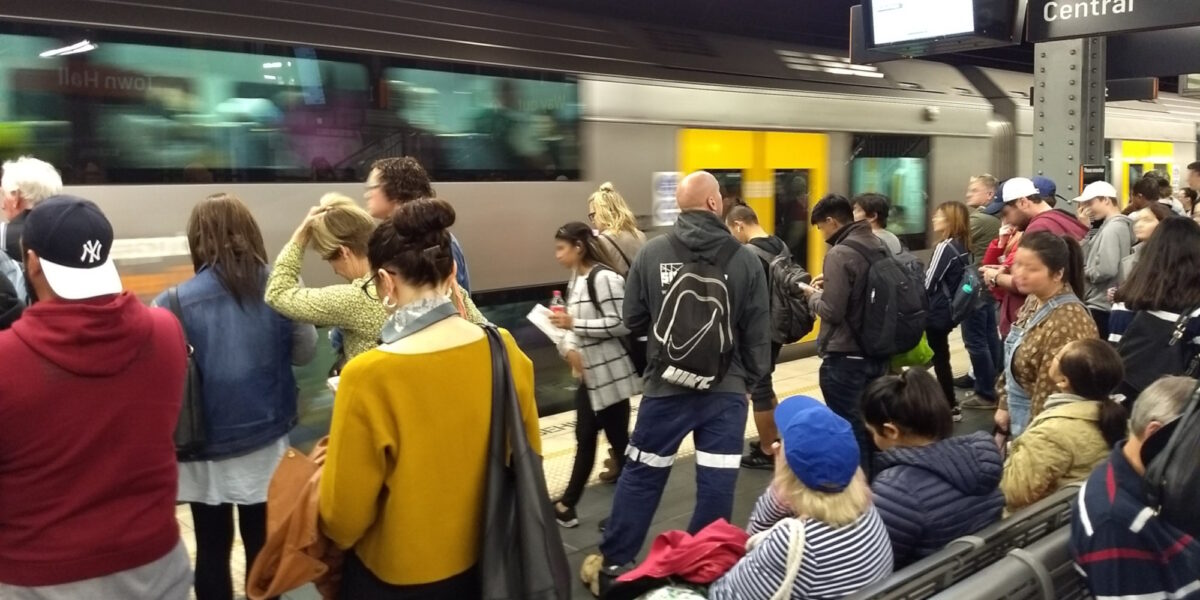
Spotify’s recent “Wrapped” release of listening data prompted the American Public Transit Association to release a “TransitWrapped” graphic highlighting the busiest US transit systems. They also did a version for Canada. I was asked how this would look for Australia, so I’ve found the data for 2022-23, for the biggest capital cities with rail services. ... [More]
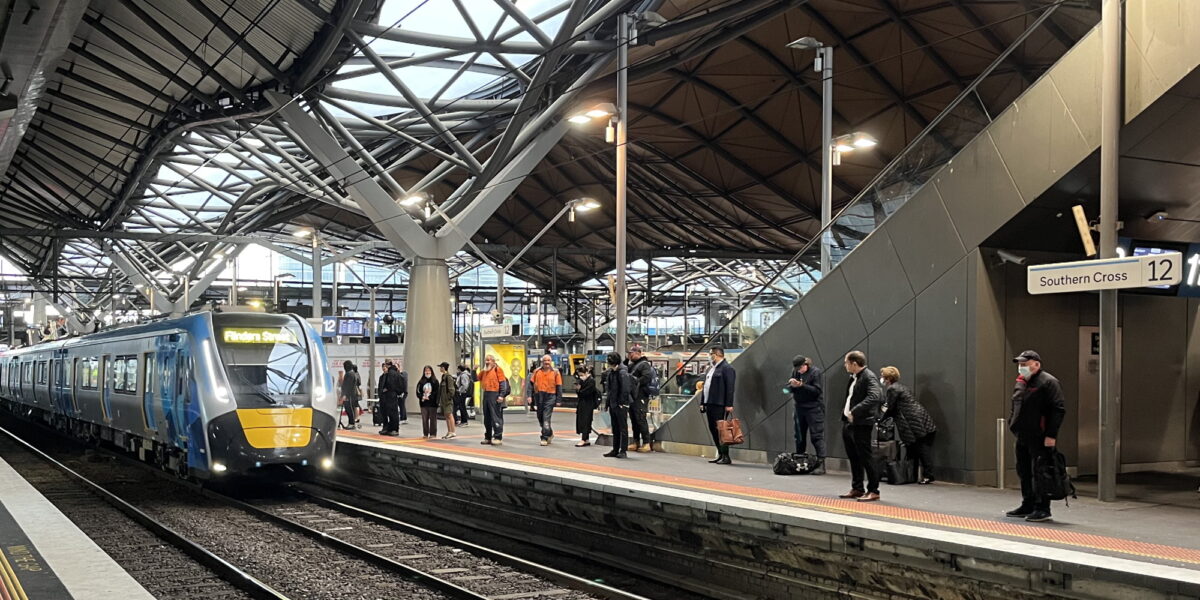
Public transport patronage and revenue are recovering fast, but are still not back at 2019 levels
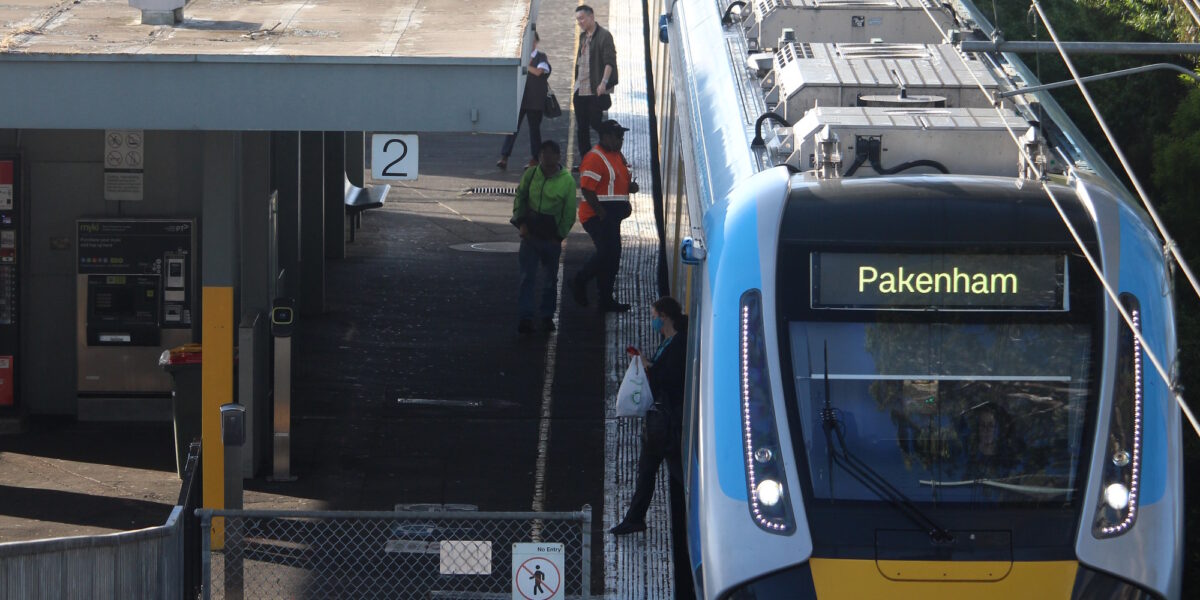
Newly published data shows how public transport patronage was recovering during 2022.
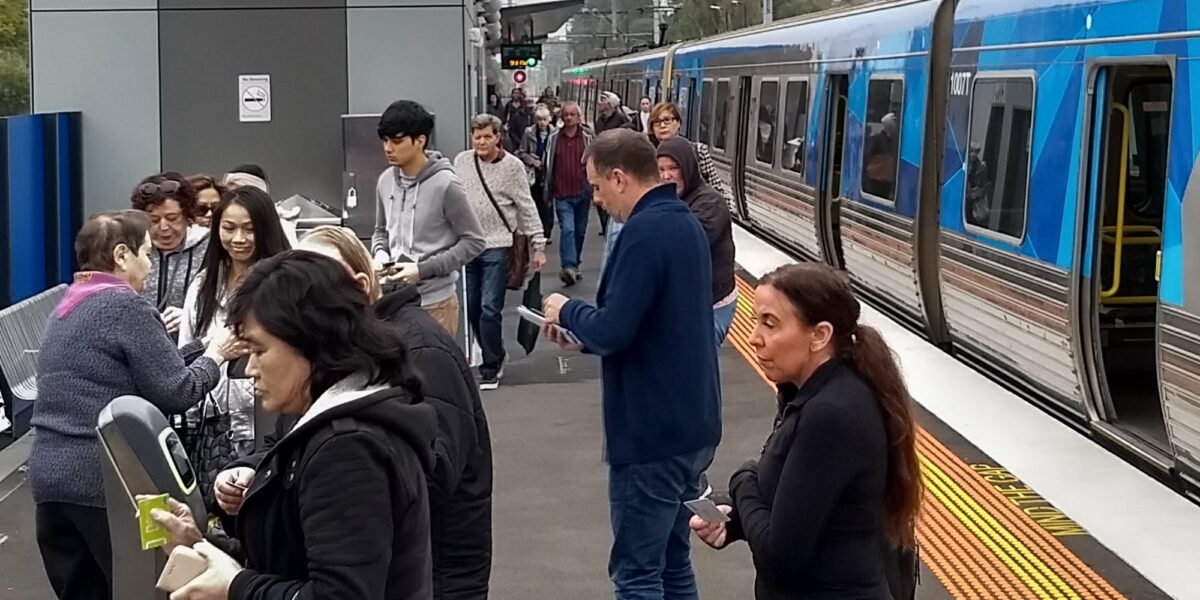
In less than five years, Southland has become the 7th busiest station on the Frankston line
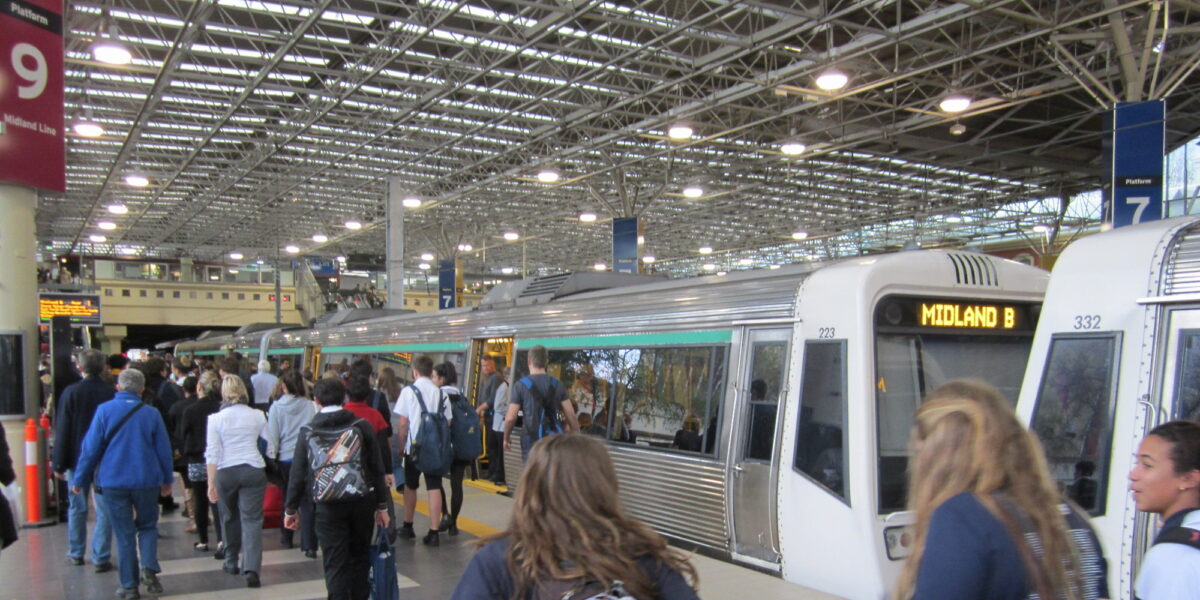
Obviously, travel demand in cities is in turmoil just at the moment, but leaving the 2020-2022 blip aside for a minute, and looking again at pre-COVID travel in cities… As a follow-up to comparing Melbourne’s public transport patronage to Sydney’s, I thought I’d look at all the big capital cities. The five biggest are also ... [More]
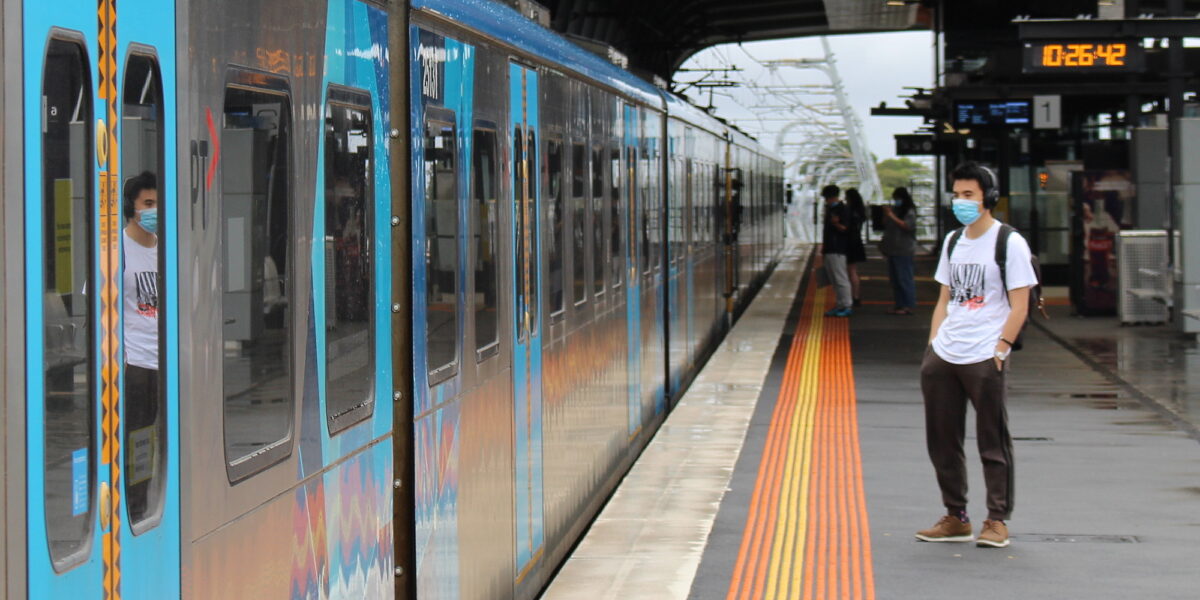
The pandemic has resulted in millions of people staying home, with overall travel demand dropping significantly. This is clearly shown in the annual public transport patronage figures from the State Budget Papers released in May. Now we have a new piece of info: annual fare revenue – from the Department of Transport annual reports, the ... [More]
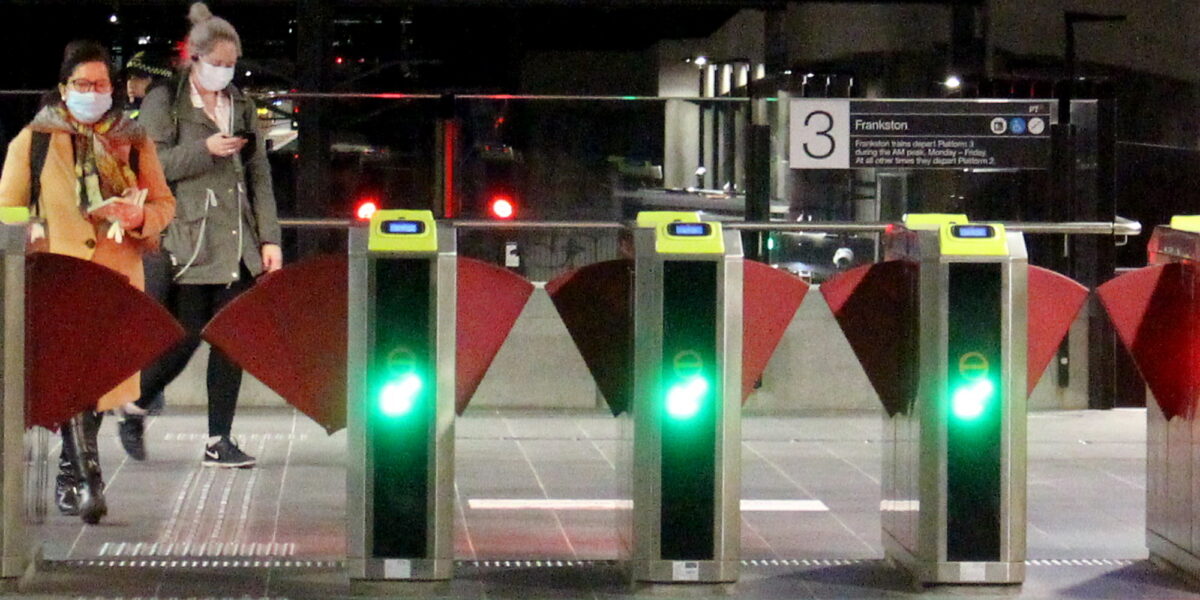
Just a quick post today. The State Budget Papers obviously give an overview of the state’s finances, and new funding initiatives. In Victoria, they also provide the only regular, consistent view of metrics for a range of government services, including public transport patronage. (In contrast, other states put this data out far more regularly.) Anyway, ... [More]