Via the Department of Transport Annual Report released last week, here’s an update of a chart from last year – showing revenue and patronage for the financial year 2022-23.
Everything here is in millions – fare revenue dollars (the dark red line) and passengers carried.
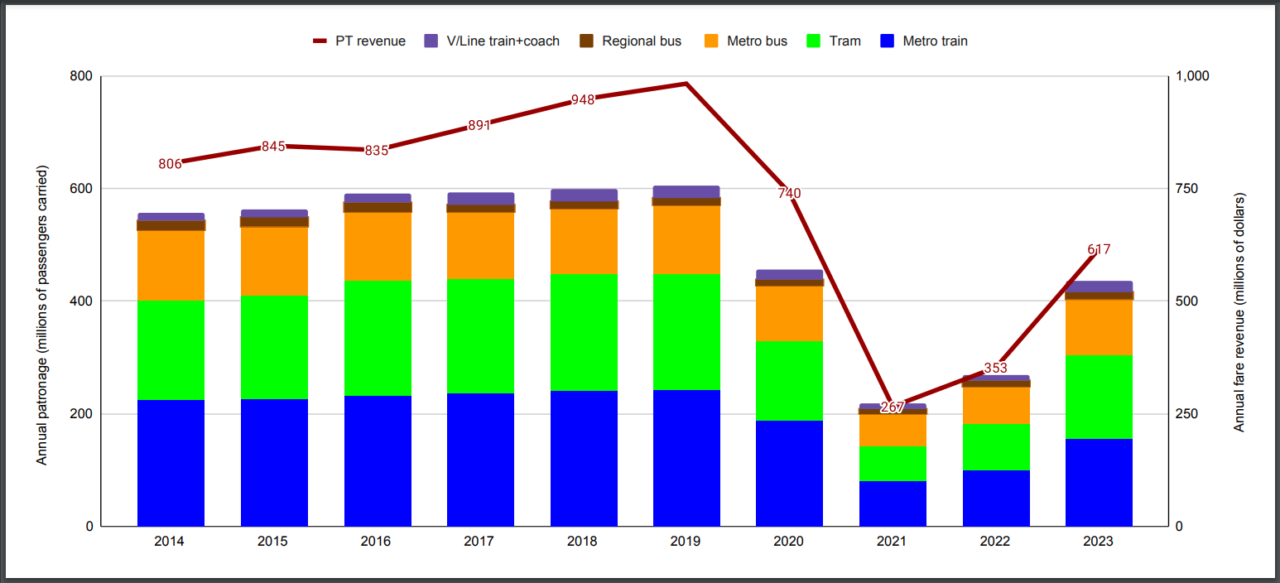
Obviously the low point was 2020-21, when much of the year was spent under COVID-19 lockdown, particularly in Melbourne.
But we can see the recovery following the lifting of COVID restrictions, with fare revenue for 2023 at 62.8% of 2019 levels, and patronage at 71.9%.
Looking at the patronage data by mode shows varying levels of recovery.
| Year ending June | 2019 | 2023 | 2023 % of 2019 |
| Metro train | 243.2m | 157.1m | 64.6% |
| Tram | 205.4m | 147.6m | 71.9% |
| Metro bus | 121.8m | 99.7m | 81.9% |
| V/Line train and coach | 22.4m | 18.7m | 83.6% |
| Regional bus | 13.1m | 12.4m | 94.7% |
| Total | 605.9m | 435.5m | 71.9% |
We know journeys to the CBD are still well down, especially in peak, and especially on Mondays and Fridays, due to ongoing widespread Work From Home for office workers. There’s some more data that I’ll explore in a future post, but it’s a reminder that government should be planning and funding the public transport network to more actively chase patronage for non-CBD, non-peak trips.
White-collar Work From Home also explains why metro train and tram have not bounced back as far as buses – historically they have been very focussed on CBD peak journeys. In contrast, much of the bus network serves non-CBD trips.
V/Line saw a big uptick in patronage after the 31st March fare cut, but only a quarter of the 2023 financial year data is after the change – and much of that was affected by major works. So we’ll need to see more recent data to really understand how much patronage has increased.
Still, it’s interesting to see how things are bouncing back.
5 replies on “Fare revenue and patronage recovery”
If patronage and revenue were recovering quickly, they would have recovered last year. Nights and weekends did recover fairly quickly but weekday and peak travel have not recovered, causing the overall trend to be slow at best.
Very interesting.
From the data you provide, I calculate that revenue has fallen from $1.62 to $1.42 per passenger. Over the same four year period, (national) CPI has risen 16.5 per cent (a proxy for cost increases). So revenue has declined as the cost of providing services has increased. It shows the state government transport subsidy has risen sharply since 2019.
One of the reasons the state is in such debt!
To serve the non CBD market more competitively a half fare for trips less than 5km would help. Most of these are for shopping or local work, and the current fares are too high for short trips. There would be little erosion of fare revenue as many at trips into the CBD are more than 5km.
Re Malcolm’s comment – we’ve gone the other way over time and made long journeys into the CBD cheaper (including most recently the statewide fare cap) but outer suburban fares in Zone 2 are still cheaper. Previously there were cheaper options in Zone 1 for short single trips, which would’ve balanced the relative cost of a similar length journey in Zone 1 compared to Zone 2. It begs the question as to whether without that option Zone 1 is too big. Has there been any review of where Zone 1 starts and stops since the original Inner neighbourhood was introduced over 30 years ago?
[…] 2022-23 annual report time for state government organisations, and apart from checking the patronage and fare revenue data, it’s also worth checking the Department of Planning and Transport number for how much […]