The newly renamed/reorganised Department of Transport and Planning has updated some of their stats on the Data Vic web site.
Monthly public transport patronage by mode now goes up to September 2022.
Annual regional train station patronage and Annual metropolitan train station patronage have been published for 2021-22.
There’s all sorts of ways to slice and dice this type of information, but I was particularly interested to see how patronage is recovering from the pandemic.
Monthly patronage
COVID-19 isn’t actually over, but many people are treating it as if it was. This doesn’t translate into pre-2020 normality though: lots of white collar workers are still working from home – and with many employees liking it, and some employers finding people are more productive at home, don’t expect it to change any time soon.
So has PT patronage recovered? No, but it’s getting there.
Here’s the Monthly patronage data in a simple graph.
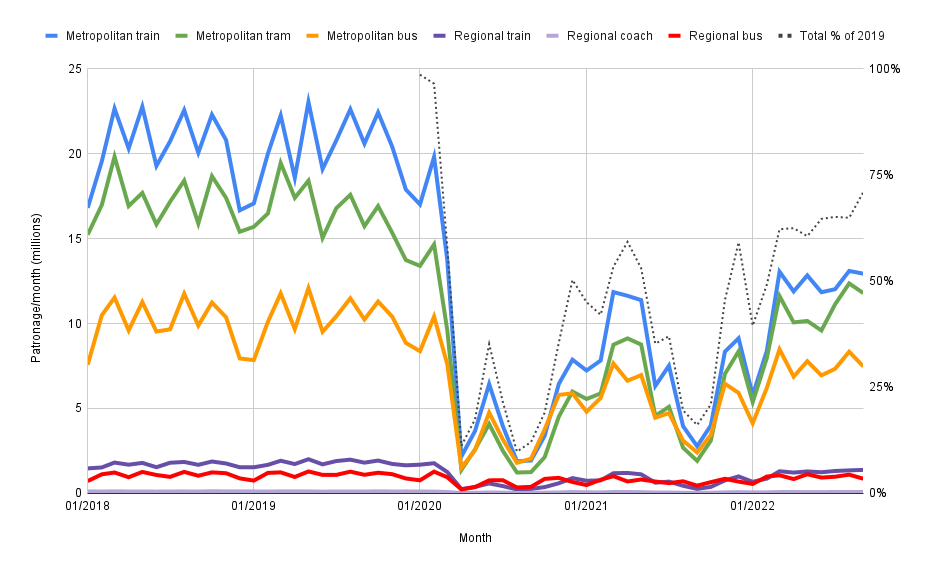
Monthly isn’t the best way of measuring this, because months vary in length and number of weekdays vs weekends. But it still shows at a high level what was going on up to September last year.
We all know about the early-2020 plunge. 2021 was rocky thanks to continuing lockdowns. But by early 2022, some kind of normality seemed to have emerged, and by September total patronage was around 70% of 2019 levels.

Rail: Peak vs off-peak
But it’s not as simple as saying patronage is at 70% of normal. Anecdotally, in recent months peak is still quieter than 2019, but at other times the system is as busy as it was pre-COVID.
What if it was possible to compare different times of the day and week?
Fortunately, the metropolitan station entry data has a breakdown: apart from the total annual figure, it’s also got weekdays, “normal” weekdays, school holiday weekdays, Saturdays, Sundays, and for weekdays it’s got pre-AM peak, AM peak, interpeak, PM peak and post-PM peak (eg evenings).
The numbers have been rounded, and for some very quiet stations they look to not be terribly reliable. For instance some stations show a number of 50 per period on a weekday, but also a total of 50 for weekdays. This clearly doesn’t make sense, so I excluded those types of low numbers.
But if we take the network-wide figures and compare 2022 with 2019, we get some interesting results.
- Annual patronage: FY2022 was at 41% of FY2019
- Weekday: 38% (this was actually the same was for all weekdays, “normal” weekdays and school holiday weekdays)
- Pre-AM peak 41%, AM peak: 34%, Interpeak 46%, PM peak 38%, Evenings 43%
- Saturday: 55%
- Sunday: 54%
Remember, this is the year up to June 2022, not September as with the above figures – which is why the 41% and the ~70% numbers above are so different.
It’s worth emphasising that the financial year 2021-22, included lockdowns totalling 89 days, so patronage is likely to have recovered much further than is reflected in this data.
By station
Looking at the top 5 stations where patronage had recovered the most, overall and at some different times of the week:
| Annual | Normal weekdays | AM peak | Saturdays | Sundays |
| Moreland 70% | Moreland 68% | Flagstaff 53% | Merinda Park 100% | East Malvern 100% |
| Hughesdale 62% | Noble Park 58% | North Melbourne 50% | Moreland 93% | East Richmond 83% |
| Merinda Park 60% | Dandenong 57% | Melbourne Central 50% | Spotswood 83% | Moreland 82% |
| Noble Park 60% | Sunshine 56% | Dandenong 49% | East Malvern 83% | Merinda Park 80% |
| Jacana 59% | Westona 57% | Craigieburn 48% | Burnley 81% | Hughesdale 80% |
*There’s also a claimed number of 150% for Flemington Racecourse on Sundays, but I assume this number is dodgy. I also removed Mernda and Middle Gorge, which appeared at or near the top of some categories, because these only opened in August 2018, so the 2021-22 data looks good compared to 2018-19.
As to why these particular stations have recovered faster than others, some theories:
Some locations such as Merinda Park, Noble Park and Dandenong might be more likely to have passengers commuting to jobs that are commonly performed on-site, so they have recovered quickly.
Hughesdale might be boosted by its proximity to Chadstone, though I’m not sure about this, as Southland didn’t do quite as well. Also not sure about Westona – does it get used by a lot of students?
I’m not sure about why Moreland has done so well – possibly the afterglow of the shiny new station helped, but does it have any nearby major traffic generators? (It closed for rebuilding in July 2020, not during the 2018-19 financial year.)
Flagstaff and Melbourne Central are in the top 5 for AM peak, but remember this is station entry data, so this suggests a lot of local residents using those stations for a counter-peak commute. (See a PM peak comparison below).
East Malvern and Burnley are used for bus replacement operations, especially on weekends, which may explain why they landed in the top 5.
CBD stations
A couple of the CBD stations featured in the top 5 for AM peak entries (eg counter-peak travel), but how are the rest of them doing generally?
| Station | Annual | Normal weekdays | PM peak | Saturdays | Sundays |
| Flinders Street | 40% | 36% | 32% | 57% | 56% |
| Southern Cross | 32% | 28% | 24% | 51% | 53% |
| Flagstaff | 35% | 33% | 31% | 63% | 59% |
| Melbourne Central | 36% | 34% | 33% | 45% | 42% |
| Parliament | 29% | 27% | 24% | 54% | 47% |
Note I’ve used PM peak here, as the data is station entries, so this better reflects peak hour usage.
By location
To try and see if there was an overall pattern across the network, I also tried plotting the 2022 vs 2019 Annual patronage percentage on a map. Dark blue means higher recovery. This also highlights that some of those outer suburban stations are higher than others, but other standout patterns are eluding me.
Click on a station to see the data. Note the “Annual 2022 vs 2019” number is really a percentage – but Google Maps doesn’t like doing the colour ranges if it’s formatted as a percentage.
If anybody’s got other theories or ideas on how to slice and dice this data, or if you spot a mistake I’ve made, let me know in the comments!
And if you’d like to explore the data yourself, the links are below. (I haven’t looked at the V/Line data yet… hopefully soon.)
- My working in Google Drive: 2019 vs 2022 station patronage, and monthly by mode
- Data Vic: Department of Transport and Planning
12 replies on “Patronage: is it coming back?”
It will be very interesting to see what the $9.20 cap on fares statewide will have on V/Line patronage.
The next set of data will show a pretty sharp drop for the Belgrave/Lilydale lines because the replacement bus services are largely unusable and a LOT of people will be staying home.
The time lag in the data availability is certainly unfortunate, as we’re still looking at least 4 months ago at what is clearly still an evolving situation. Anecdotally, WFH practices have been shifting around more recently with workplaces getting more strict about minimum days per week in the office. 2022 patronage has been entirely consistent with anecdotal reports most CBD workers were only going to the office 1 to 3 days per week.
Some great analysis there as always Daniel.
A couple of thoughts on the some of the results:
Hughesdale was closed for about 9 months for Skyrail works – 14 October 2017 until 25 August 2018 (thanks Wikipedia for the dates). 2018-2019 FY is effectively missing two months, plus a lag in people returning from using other stations in the area (Murrumbeena, Oakleigh and East Malvern).
Merinda Park patronage is growing alongside the housing boom in Clyde North, helped by the 2021 station rebuild as part of the Cranbourne Line duplication. I can’t find clear figures for any extra parking added (unlike Lynbrook which gained 135 spaces), but they did add a ‘temporary” gravel carpark on the south-west corner (beside Thompsons Rd) which is still in use. The 881 bus to Clyde North was also added in January 2022.
Would some Point Cook residents be inclined to start using Westona? I was at Laverton last Tuesday and was a little surprised that the carpark was 95% full late morning (only spaces at the far end of the north-side), unlike many stations where some spaces still remain all day.
@Philip, the crossing removals always affect rail patronage – but yes, so far the bus replacements for the Surrey Hills/Mont Albert closure don’t seem to be coping well.
@Tony, I’m hearing they’re working on reducing the lag for this data. And looking back on the Data Vic site today, there’s another data set they’ve released this morning.
@Craig, great point about Hughesdale; I didn’t think to check. Laverton is an interesting one – I wonder if it’s the old habit of going for the Zone 1 station, even though it doesn’t matter anymore.
Fascinating. Thanks Daniel. I wonder if Parliament is so low, in part because it was a great way to get to Richmond in 2019 (Plat 2 or 4) but now many commuters would go to Flinders St to avoid longer wait times on Plat 4?
Curious about the post-September 2022 figures. The government’s work-from-home recommendations were only lifted on 2022-09-01 and the public transport mask mandate on 2022-09-22 (although usage had already dropped off substantially by then). Mandatory isolation ended on 2022-10-14. I’d expect some increase in patronage as the restrictions were lifted.
Westona station has a secondary school next door to it, so that probably explains the patronage there.
Anecdotally, the morning peak escalator queues at Southern Cross are now just as terrible as they were pre-Covid.
@roger A byproduct of running all frankston trains through flinders now? Not sure when that started exactly.
As a peak commuter on Frankston line i’m kind of loving the reduced patronage. I can always catch my train and never have to sardine like i did in the old days. I remember when I was living in Yarraville, switching trains at north melbourne to get to Parliament was basically a sentence to spend 20 minutes in someone’s armpit.
@David, great point – we’ll see what the following months show, though preliminary data I’m aware of still shows peak is well down on 2019 levels.
@Alexander/@Roger, The remaining few Frankston line trains came out of the Loop in early 2021, and more significantly the Dandenong line (Caulfield Loop) started running anticlockwise fulltime.
https://danielbowen.com/2020/12/01/new-train-timetables-january-2021/
As a single data point, often travelling the network I notice since the pandemic.
1. Crowding on weekends in the usual peak directions (inbound morning, outbound 5-6 pm). The current timetable is serving these passengers poorly.
2. More passengers between 9am and 10am in the usual morning peak direction.
3. Interchange is becoming more frustrating, with fewer services using the loop and Flinders Street underpass closed. Southern Cross is the worst place to interchange (at peak still requires more than 5 minutes if you have to pass the concourse).