The pandemic has resulted in millions of people staying home, with overall travel demand dropping significantly. This is clearly shown in the annual public transport patronage figures from the State Budget Papers released in May.
Now we have a new piece of info: annual fare revenue – from the Department of Transport annual reports, the latest of which was just tabled in Parliament.
Note: throughout this post, when I refer to a year, it’s financial years, eg the 12 months ending June of that year – this is how the source data is published.
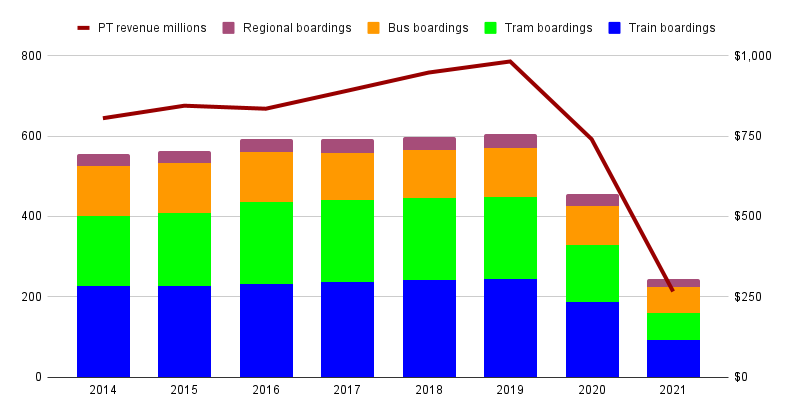
Here’s how patronage and revenue looks.
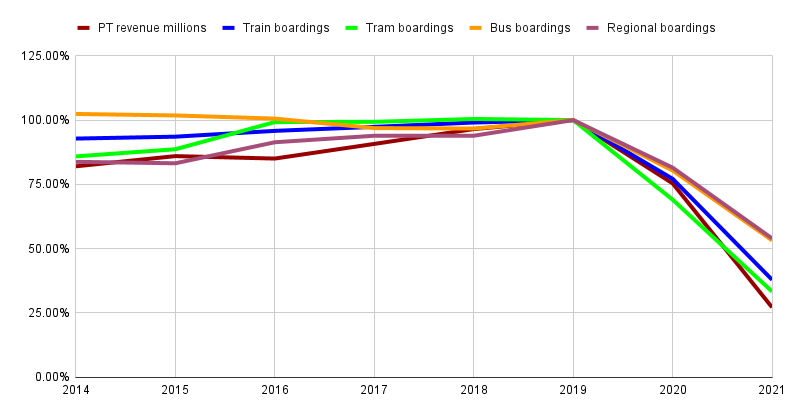
Here’s the same data showing the trend 2014-2021. (I’ve used 2019 as the baseline. This is possibly confusing, but it’s relevant in the text below).
Notes on the data:
- The 2021 patronage number was the expected total, as of May when the Budget Papers were released.
- I think the revenue figures are comparable year-on-year, though the wording in the PTV/DOT annual reports is a little cryptic. It includes other (presumably relatively minor) revenue such as station locker hire.
- For the Regional Patronage number I’ve combined V/Line train and coach with town buses, to make it more visible in the first chart
So what can we see here? Here are a few things I’ve noticed:
Growth before COVID
Strong growth for some modes occurred between 2014 and 2019.
Regional patronage went up thanks to V/Line adding services and stations in Melbourne’s outer western suburbs – both as part of the Regional Rail Link project (opened mid-2015) and subsequently.
Tram patronage also jumped, with patronage growing after the Free Tram Zone started in January 2015. Not much growth since then however.
There were also fare zone changes which cut the cost of some trips from January 2015. Overall fare revenue initially fell in 2015-16, but then rose again with metropolitan rail patronage – which might indicate that the price cuts and service upgrades during that time encouraged more people onto the network.
Metropolitan bus patronage dropped a bit between 2016 and 2018. The State Budget Papers in those years cited cheaper petrol prices, and the impact of infrastructure upgrades. I suspect it’s more complex, and varies by area and route – for instance Transdev routes had terrible punctuality and reliability problems around this time. Patronage was recovering by 2019.
…And then COVID hit.

The pandemic hits
The year ending June 2019 was the last “normal” year. For the following year, patronage was unaffected until March, when it dropped off dramatically. And the year ending June 2021 showed the full effects of Melbourne and the rest of the state going in and out of lockdowns.
In fact patronage for 2021 was the lowest since at least 1947. It would be interesting to find out if there is data somewhere from earlier than that.
Pre-COVID, revenue was approaching a billion dollars a year. Fares need to be affordable, but they also clearly play a valuable role in helping to fund services.
Comparing 2019 to 2021, revenue fell a lot further than boardings. Overall 2021 boardings were down to 39% of 2019, revenue down to 27%.
This may reflect that the system lost of lot of the longer more expensive journeys (including those into and around Zone 1), with many CBD and inner-suburbs white-collar employees working from home, and non-work trips in PT-rich areas restricted during lockdowns.
This is also reflected by comparing the modes for Melbourne:
- Tram patronage for 2021 was just 33% of 2019
- Train was 38%
- Bus was 53%
So bus patronage was proportionately higher. My assumption is that more on-site workplaces are in areas accessible by bus rather than by train and tram. This is a common theme in other cities around the world.
Regional journeys in 2021 were at 54% of 2019. If we separate the modes here for a minute, V/Line dropped further (43%), whereas town buses were closer to normal (72%), reflecting that COVID-19 restrictions and lockdowns didn’t hit regional Victoria as badly as Melbourne.
It’d be nice if we had month-by-month patronage figures. Unfortunately unlike in other states, Victoria only publishes this data once a year.
Not a surprise
Ultimately, the huge drop in public transport patronage and revenue is totally unsurprising.
What happens next?
The government can influence the outcome. They could revise fares – PTUA proposes replacing the 7-day Myki Pass with a cap, and bringing back the off-peak discounts, among other changes.
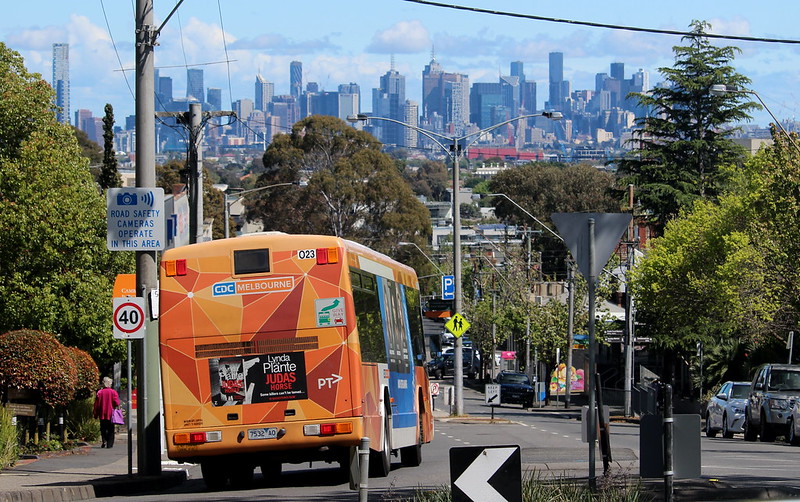
But more importantly, they should also upgrade public transport where overall travel demand has been strongest. Metropolitan and town buses definitely need attention – to provide better, more direct, more frequent, more usable services. The Suburban Rail Loop will be of benefit, though that’s years away. Relatively short tram extensions to improve suburban connections to rail and major centres would also help.
While there have been permanent changes to things like white-collar work locations, I think most patronage will come back eventually. How quickly might depend on what actions the government takes to ensure the system meets changed travel patterns.
3 replies on “PT fare revenue has plummeted”
One of the most interesting comparison cities for furture rail patronage is Perth, which was less affected by lockdowns and has seen rail patronage rise to 80% of pre-COVID levels. In the US, despite earlier access to vaccines than Australia, office workers don’t seem to have fully returned to their offices in San Fransisco, as evidenced by BART’s weekday patronage is still only 22-28% of pre-COVID levels. Interestingly, Perth with a population of only 2 million, now has much higher rail patronage (49 m/yr) than BART (~38 m/yr), which serves an area with a population of ~7 million. Both systems have monthly ridership statistics on their websites.
[…] 2021: A more recent post on overall fare revenue […]
[…] was thinking I would update the chart on public transport patronage and fare revenue – then the State Coalition dropped some election pledges on fare cuts, which are worth […]