Spotify’s recent “Wrapped” release of listening data prompted the American Public Transit Association to release a “TransitWrapped” graphic highlighting the busiest US transit systems. They also did a version for Canada.
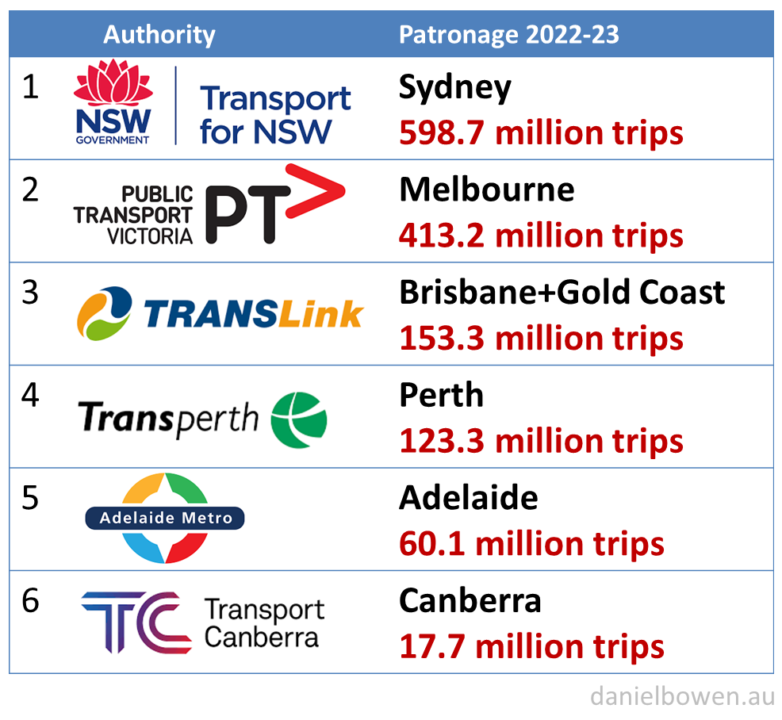
I was asked how this would look for Australia, so I’ve found the data for 2022-23, for the biggest capital cities with rail services.
(Getting numbers for capital cities specifically is a bit tricky in some cases, so this may not be exact. Footnotes below.)
Interestingly, if you compare the Australian cities to the American ones, Sydney and Melbourne would rank 2nd and 3rd, between New York City and LA.
Obviously Australian cities vary in size, so you can expect big regions like Sydney and Melbourne to have more PT use than Adelaide or Canberra.
But Sydney and Melbourne have similar populations. Why do Sydneysiders use PT so much more?
Breaking it down by mode provides some insights.
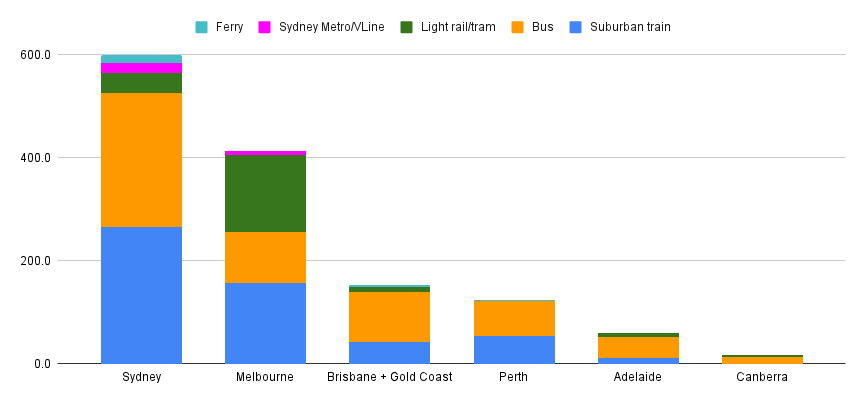
As I’ve noted before: Sydney does so well thanks to their train network being so well used (serving more major destinations, and running more frequently than other suburban rail systems at most times of day), and their bus network now carries more people than Melbourne’s buses and trams combined.
Also notable is that Brisbane’s buses carry almost as many passengers (97.2 million) as Melbourne’s (99.7m). Brisbane is a smaller city, but uses buses for both local and longer trips, thanks to significant investment in Bus Rapid Transit.
Melbourne’s buses don’t have to be laggards. Infrastructure Victoria has a new report showing how they can be improved. (And past experience with Smartbus shows that if they are improved, people will use them.)
Footnotes:
- Patronage data sources: Sydney, Melbourne, Brisbane, Perth, Adelaide, Canberra, noting the caveats below.
- Sydney is calculated using statewide totals from the TfNSW Annual Report, minus data for NSW Trainlink and Newcastle light rail/ferry. Not sure if there’s a better way of getting this.
- Melbourne includes half of V/Line patronage, as a rough estimate of suburban usage.
- Canberra annual report seems to contradict their DataACT patronage data – not sure why. I used the former.
10 replies on “PT patronage across Australia”
Interesting that Melbourne and Sydney have more PT trips than LA – despite the latter being twice the size.
Your analysis is reinforced by Journey to Work data, showing that 10.5% of Sydney-siders use public transport to get to work compared to 7.8% of Melburnians (excludes working from home, COVID affected, 2021).
Also interestingly of the Canadian cities, the number of PT trips in Sydney is only beaten by Toronto, and Melbourne by only Toronto and Montreal. Australia’s PT performance (while it could be better) is actually surprisingly good by Anglosphere standards. New York is in a league of it’s own of course.
Looking back at Chris Loader’s now pretty old population weighted density numbers, the average Torontonian or Montrealer or Vancouverite (had to look all of those up) lives at a greater density than Sydney, and Melbourne is a little further down the list.
Even Brisbane & Perth perform really well against the Canadians, despite much lower densities.
Density from. I figure even if the numbers have changed, the relative scale and positions probably haven’t changed all that much https://chartingtransport.com/2015/11/26/comparing-the-densities-of-australian-and-european-cities/
Melbourne is a much more car oriented city. If you take a look at population data, Sydney was 29% more populous than Melbourne in 1950. Why does 1950 matter, well it’s a good proxy for when urban design started to pivot from being orient around transit to being oriented around the car.
There’s a lot more Sydneysiders packed into suburbs where personal car transport is painful because the suburbs weren’t designed to support it. You can also throw in the harbour and the hills that create a lot pinch points that make transit modes more attractive.
Add in that Melbourne is really, really bad a busses and there’s your gap.
It will be interesting to see what happens to Perth’s railway patronage in a few years, when most of their massive railway expansion project pipeline should be operational. Even though Queesland is also investing in new rail transit as well, it’s primarily focussed on peak capacity upgrades and preparations for the Olympics. So given that Perth already surpasses Brisbane+GC for rail patronage, Transperth trains might potentially thoroughly eclipse for Translink’s surburban rail network in the future, which will present an interesting case study.
Ah yes, that rapid transit called SmartBus. Every 30 minutes all day today while the trains are every 10, with a bonus 9PM finish tomorrow because apparently nothing is open and no-one goes out on Sundays (the government is still living in 1953). Next to zero traffic light priority too (the worst offender by far being Lonsdale St, but really it’s a problem across the entire bus and tram network).
Also worth quoting the age-old PTUA topic “When is a SmartBus not a SmartBus? When it’s the 703”, as the timetable hasn’t changed since, still lagging way behind every other SmartBus aside from having hourly Night Network services tacked on.
[…] request, here’s a follow-up of last year’s post comparing public transport patronage in Australia’s biggest capital cities: now ranked by trips per […]
I actually do wonder how much the patronage on the Sydney’s intercity network gets factored into it, since they’re also operated by Sydney trains so is included into the stats. That actually might explain partially why there’s much more train patronage in Sydney in direct comparison to Melbourne’s network.
Correction; I’m not correct, intercity is operated by NSW Trainlink.
Sydney’s rail network is absolutely world class – especially for a legacy suburban system.
People touching on at Sunbury station could board either a V/Line service, or a suburban Metro train. Marcus, you have stated that while Metro publish per station boardings, V/Line does not. Do you know if the boardings for Sunbury include both Metro and V/Line? Given the different stopping patterns, one could not assume all passengers entering the platform just before a V/Line departure will board the V/Line service.