A remark on social media inspired this: a quick comparison of suburban train punctuality in Australia.
We have suburban rail networks in Sydney, Melbourne, Brisbane, Perth and Adelaide, and all of them publish monthly punctuality data.
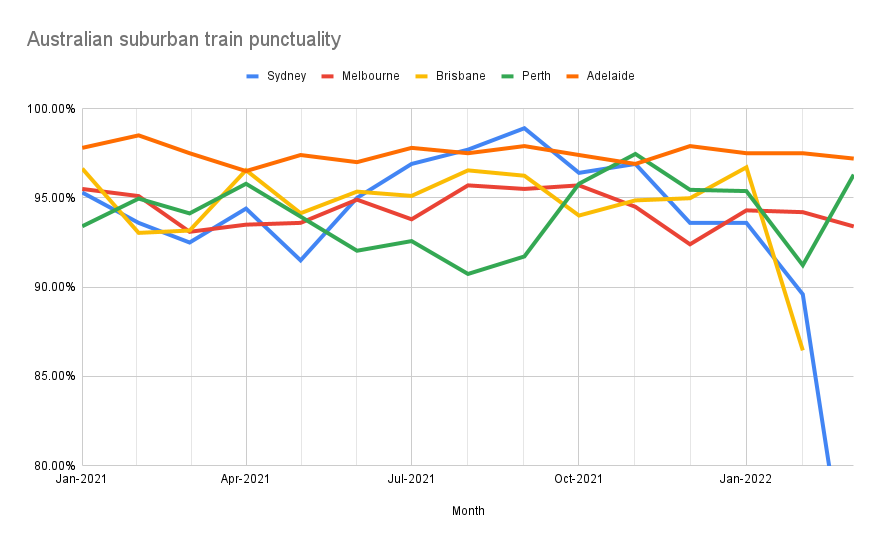
So here’s a quick graph comparing them since January last year:
Some caveats:
- Sydney, Melbourne and Adelaide consider “on-time” as within 5 minutes.
- EDIT: But note that it appears Sydney is only publishing peak data.
- Perth is within 4 minutes.
- Brisbane is within 4 minutes for most services, but within 6 for “interurban” (Gold Coast, Rosewood and Sunshine Coast lines) – they haven’t published their March figure yet.
- Brisbane publishes data adjusted for “force majeure”, but to their credit also publishes the non-adjusted data, which I have used – as it appears from Sydney’s March 2022 number that theirs is not adjusted theirs. (For the other cities it’s less clear)
The most noticeable thing here is Sydney and Brisbane taking a dive in February/March, no doubt due to the storms. And Perth seems to have had a fairly mediocre mid-2021.
Other than that, I’m not sure any of them stand out as exceedingly good or exceedingly bad, but the averages for January to December 2021 (so excluding the February/March storms) might shed some light. From highest to lowest:
Adelaide 97.51% – they no doubt did well because their rail network is so small, with mostly infrequent services, so track congestion is probably not terribly common.
Sydney 95.23% – they’ve worked hard at reducing delays over the years, including separation of services, and allowing more time in their schedules.
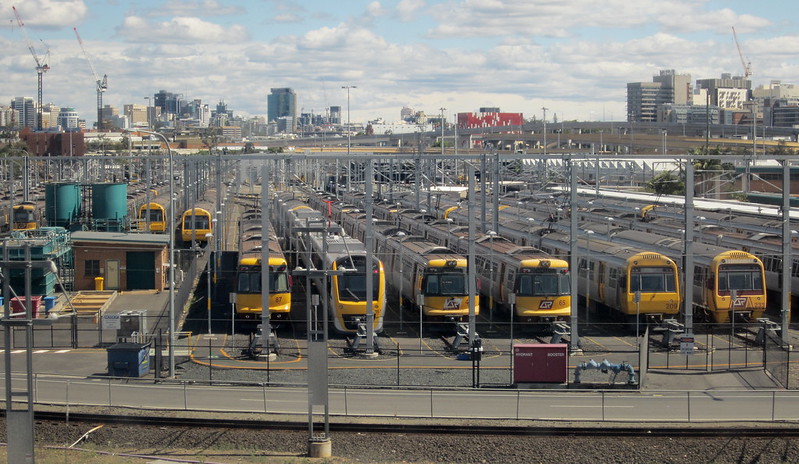
Brisbane 95.05% – their network is reasonably frequent at peak times, but mostly not outside the peaks, so major congestion issues might be mostly in peak.
Melbourne 94.44% – they are gradually removing the factors that lead to track congestion, including better separation of lines, but still has a way to go.
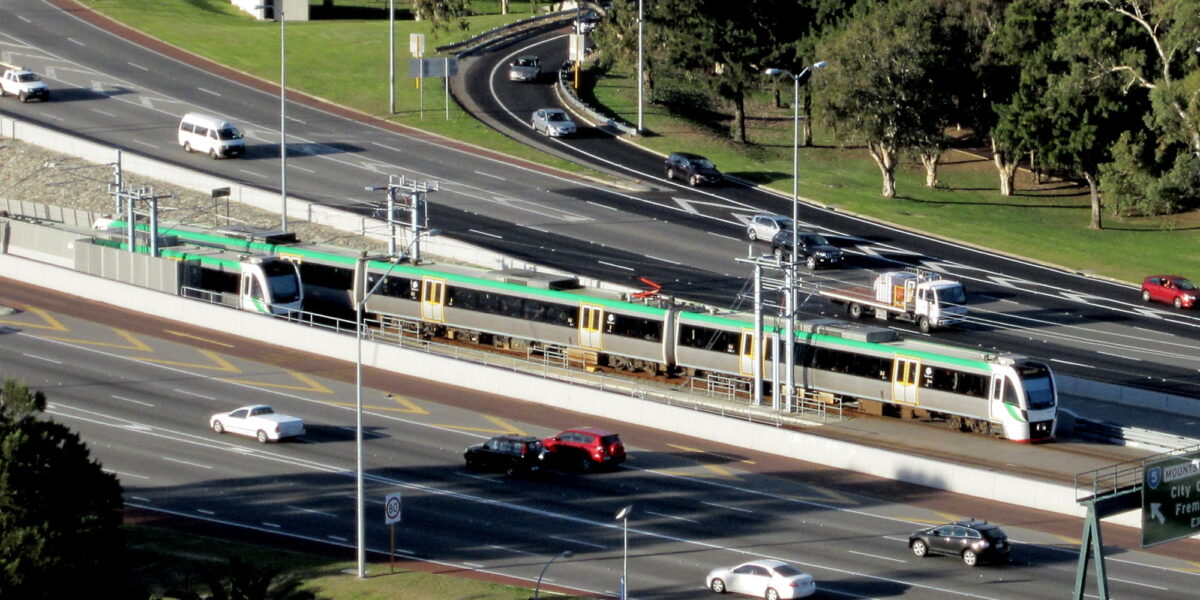
Perth 94.00% – to my mind, they have a relatively small system with good line separation. But their tighter definition of “on time” is probably contributing to their lower result.
Punctuality is affected by different factors. The Sydney page has some good information listing some of them, which apply on any system.
This comparison isn’t perfect of course, thanks to the slightly different measures used. But I’d argue it’s a more objective view than those surveys of passenger satisfaction, which don’t directly compare the systems, and usually conclude that the smaller the train system, the happier passengers are about it. Not really surprising, but is that really the main determinant of a successful system?
To my mind, punctuality, frequency, and ridership (per capita) are good measures, if you can get comparable data.
Ultimately, Australian’s suburban rail systems need to keep improving, to help provide better transport options, allowing people to easily cut their transport emissions, and to help improve the cities they serve.
11 replies on “Train punctuality around Australia”
Thanks again for doing the research and analysis on issues that are important to PT users. Punctuality, as well as frequency of service, is the cornerstone of network performance.
My Melbourne train is still only half full compared to pre-COVID so I’m not surprised a high figure of 95% of trains are on time. Interesting observation regarding the floods. Brisbane is more use to 500mm downpours than Sydney.
You’d expect that with all the billions of dollars of investment in untangling Melbourne’s train network, one of the dividends should be that we can tighten up the definition of “on time”. Do you know what measure other comparable systems globally use?
I agree about the measures of customer satisfaction. People can express dissatisfaction with crowded services and fair enough, but crowding is a sign of a service is that is in demand; it can’t be all bad.
Perth had some bad temporary speed restrictions on the Armadale/Thornlie Line (by far the most operationally complex one) for much of 2021 – from memory the worst were 20km/h between Claisebrook and McIver (down from 55) and around 500m out from Thornlie (usually up to 100). Combine this with timetables that generally have very little slack in them…
A good question from Rick above.
I think typically a measurement of within 3-6 minutes is common.
From a quick look around, bearing in mind these are nationwide networks, not suburban services.
UK publishes various figures, including: 89.5% within 3 minutes, or 94.4% within 5 minutes. Their targets however are based around 5 mins for short distance, 10 mins for longer distance.
https://www.networkrail.co.uk/who-we-are/how-we-work/performance/railway-performance/
Switzerland: 93.7% within 3 minutes
https://company.sbb.ch/en/the-company/responsibility-society-environment/customers/punctuality.html
Germany: 75.2% within 6 minutes
https://www.iamexpat.de/expat-info/german-expat-news/deutsche-bahns-punctuality-slumps-again-1-4-trains-late-2021
This BBC article from 2017 did some comparisons:
https://www.bbc.com/news/world-asia-42024020
I wonder how cancellations factor into the punctuality figures? Perhaps I’ve just been unlucky, but recently I seem to have been in a couple of situations where Metro has cancelled a train rather than run it late.
Sydney’s dip will be in part due to the train strike too
An interesting omission from this comparison is Sydney Metro, which, while relatively small at the moment, is about to become a major second rail system for Sydney within the next few years. The reason that on-time running is not reported in TfNSW stats is apparently because, as an automated system, this performance standard is not included in the system’s KPIs. It seems that there is good reason for this as, after the initial running in period, it has performed very precisely and it takes some sort of rare mishap to throw things out. The internal standard for on-time running is quite strict – anything over one minute behind is defined as late.
So the only other way for the public to assess this performance standard (other than personal experience) is customer satisfaction surveys. In Sydney over the past couple of years since the metro and L2/L3 light rail opened, the metro and ferries have rated the highest overall at 99 to 100% satisfaction. Suburban trains, buses and light rail now sit at about the 93% level. Specifically on the survey question of running on time, suburban trains, buses and light rail rate a dissatisfaction level of between 5 and 10%, while the metro rates at 2% and the ferries at 1%. On journey time, the metro rates at 0% dissatisfaction, the ferries at 1%, buses at 4% and suburban trains and light rail at 7 and 8% respectively.
In Canstar Blue’s latest (2021) survey of rail passenger satisfaction, Perth (as usual) has come out top and Melbourne (as usual) has come last. On the specific question of punctuality, Perth rates best, Adelaide and Brisbane sit in between and Sydney and Melbourne rate worst. It seems to me that there is a strong relationship between the size and complexity of systems though Perth is obviously an exceptional performer regardless. I hope that they include Sydney Metro in this survey next time.
@gxh, for Melbourne at least, there’s a separate number for cancellations, including for diversions out of the City or Altona Loop, and for skipping stations.
@Tony P, interestingly I notice the Toronto TTC appears to measure punctuality by how they maintain service headways (if I’m reading this right) https://www.ttc.ca/customer-service/daily-customer-service-report
It’s also notable that some systems (e.g. Sydney) only report on peak punctuality, whereas for others (e.g. Melbourne) the figure is for all services that operated during the month.
It also looks like lockdowns helped to increase those overall figures, e.g. Sydney Trains had 98.9% punctuality in September 2021, which was during a lockdown whilst a Sunday timetable with additional peak services was operating daily. Other months did far worse.
@Jim, thanks for spotting that issue with Sydney data and peak only. Not sure how I missed it (though the wording on the page is a bit vague).