In the world of public transport, services are what counts.
Infrastructure is important, but ultimately, infrastructure is only built to enable services.
If the train only runs every 40 minutes, it’s a long wait whether the station is 100 years old, or shiny brand new.
Today is State Budget day, and it’s a good chance to look at the overall level of service around the network. The Budget Papers (the Service Delivery book) includes figures for total service kilometres for each mode.
To put these figures in context to see how the network is expanding against population growth, we can calculate service kilometres per person.
So how’s that tracking? These graphs are based on the 2018 Budget Papers:
(Edit: 7/6/2019: I messed up and used the wrong numbers on this graph. Corrected and updated below.)
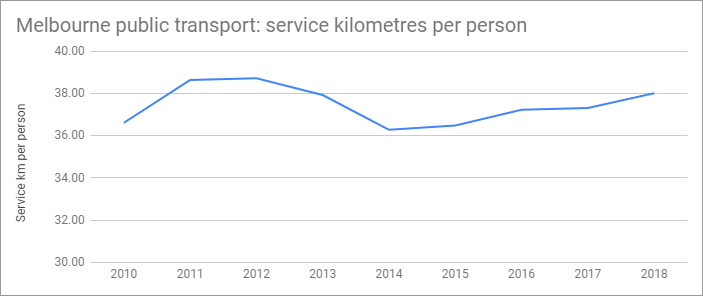
On the face of it, that looks okay. It’s going up. Bus kilometres in particular show some growth.
However one should always be cautious about the most recent years. 2017 was the expected outcome, and 2018 was the target. We’ll see what those say in the 2019 budget papers.
(My assumptions: I’ve used metro train, metro bus and tram, and a portion of V/Line service kilometres, because V/Line serves parts of Melbourne’s west. And I’ve used Census figures for greater Melbourne’s population.)
Focusing on just Metro Trains, which is the backbone of the public transport network:
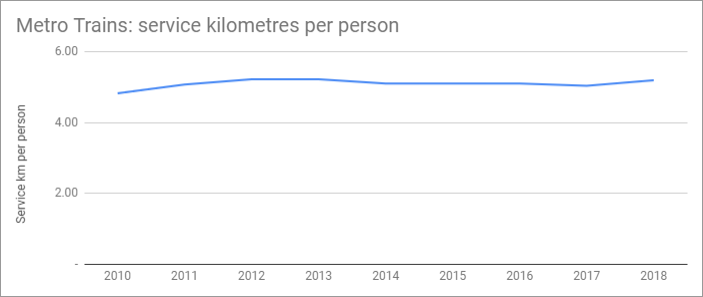
Again, an uptick. But the underlying figure for 2018 was a target of 23.8 million kilometres, a rise from 23.1 – or a bit over 3%.
Has that actually happened? Probably – the 7km Mernda rail extension opened, and there were some worthwhile service increases for the Dandenong line and a couple of others.
But is the overall network keeping up with population growth, both on Melbourne’s outskirts and the inner and middle suburbs? Is every line seeing more services to combat crowding across the day?
I’ll aim to update these figures later today – to see if reality has matched the forecasts, and what the plan is from here.
Update 8pm: Today’s budget includes some investment in additional train services (Metro and V/Line), expected from 2020 onwards – though the 2019-2020 expected service kilometres is the same as this year. It’s just as well something’s happening, as Metro patronage is continuing to grow – it’s looking like almost 5 million trips above the target for 2018-19.
There’s no increase in the target for tram service kilometres, and a minor increase in buses.
As a result of all this, for 2019-2020, the target service kilometres per person for Metro trains, and overall across the network, will drop slightly.
2 replies on “PT service kilometres vs population”
Are replacement buses counted as trains or buses?
How is increased capacity vehicles (less seats but more standing room in trains and trams) accounted for?
How is capacity when needed accounted for? I bet a good chunk of the service kilometers are the many mostly empty services running when the capacity is not as desperately needed.
..and why do thy always cancel the Blackburn trains in the evening when the system has issues. Seems they are seen a buffer rather than services that people actually depend on to get to the intermediate stations that the priority express services fly past.
True but doesn’t always correlate with efficiency and connectivity. You could reduce service kilometres and increase the usefulness of many bus routes by making them more direct. You could also extend Alamein out to Oakeigh and make it much more useful.