Here are a few blog stats from 2015…
Posts: 166 — more than I thought, but I suppose there’s been a post every few days.
Comments: 1,692
Top ten commenters:
- Daniel 176 (seems I still like commenting on my own posts)
- Roger 132
- TranzitJim 69
- Llib 52
- David Stosser 48
- Andrew 47
- enno 45
- John of Melbourne 44
- Tom the first and best 44
- Kiwi Nick 41
The following are from Google Analytics…
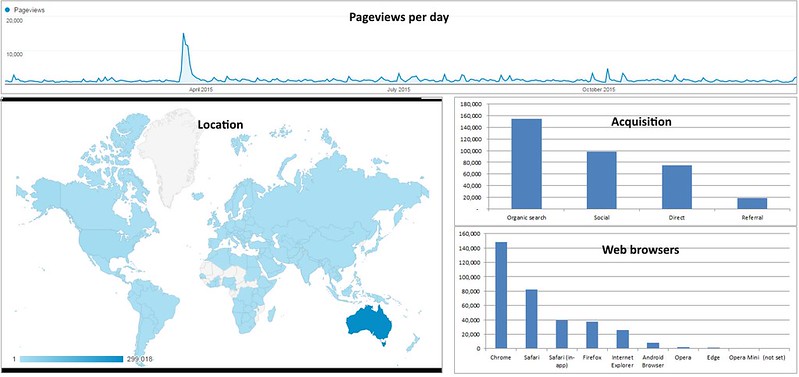
Across the year: 470,650 page views / 347,223 sessions
Per day that’s an average of 1289 page views per day, up from 986 the year before. More than I’d expect.
Busiest day of 2015 was March 24th: 13,754 sessions (15,123 page views), with 11,000 of them coming from Social Media — and almost as high for each of the following two days. It appears I got a lot of hits from Facebook that day onto the Hidden message in train seats post… I assume the post got linked from somewhere popular. (It currently has 1100 Likes in Facebook)
English language users: 95.71%
Countries: Australia 86.12%, USA 3.88%, UK 2.21%
Cities: Melbourne 68.23%, Sydney 8.60%, Brisbane 2.92%, followed by Perth, Adelaide, London, Canberra
Browsers
- Chrome 42.75%
- Safari 23.73%
- Safari (in-app) 11.26%
- Firefox 10.72%
- Internet Explorer 7.34%
Operating Systems:
- Windows 37.91%
- iOS 30.29%
- Android 17.15%
- Mac/OSX 12.16%
- Linux 1.15%
— that seems to indicate a huge number of users on mobile, which reminds me that I need to fix the quirks in my small screen blog template.
In fact, Google Analytics also tells me that desktop is 51.14%, mobile is 38.85%, tablet is 10.01%.
Most popular pages (apart from home page): Hidden message in train seats 10.82%, Identity card options 2.48%, How much power a kettle uses 1.89%. Some of these old pages seem to live on via Google.
The most popular 2015 posts were the one with detail on the Bentleigh area grade separations 1.32% (6,226 page views) and the one with detail about the next generation High Capacity Metro Trains 1.01% (4,776 page views) and the updated list of current Melbourne train types 0.84% (3,962 page views).
Search engine referrals:
- myki top up 33,687
- melbourne train map 32,827
- daniel bowen 14,092
- flagstaff station 6,412
- melbourne free tram zone 6,329
- keypass 5,844
- melbourne airport to city 4,897
- free tram zone melbourne 4,156
- proof of age card vic 3,576
- top up myki 3,501
Social media referrals:
- Facebook 44,831
- Twitter 33,649
- Reddit 18,919
- Blogger 740
- Google+ 84
— wow, this really says something about the relative use of Google+, doesn’t it… though of course it’d be higher if I posted links there more often.
I’d love to pull some stats on which categorie(s) of posts are the most popular, but attempts to work that out via the number of comments in each post category had me baffled — WordPress has changed the database design around to make it quite difficult. I’ll keep researching. Certainly in terms of page views, the transport-related posts dominated, but they seem to be most of my posts these days…
What other metrics are worth noting?
8 replies on “Some blog stats for 2015”
Interesting statistics. I had no idea that you could obtain that much info from users. What’s next: users by colour of undies worn?
Does having Google Analytics blocked interfere with the Google Analytics statistics?
What about how much money you made from ads on this website. Or what were your 20 most read articles in 2015.
So, you get views from desktops, tablets, and mobiles ? No laptops, then ?
Yes, please fix the template for mobile. I usually get here via twitter on the fruit phone, but often end up looking again at home on the laptop so I can read it easily.
@Roger, obviously I wouldn’t tell the world that you wear those undies.
@Tom, if you’re blocking it, then yes. I can live with that.
@Jacob, I make enough money that (after tax) it pays for the web hosting and a little bit of “profit”. Not enough to retire on.
@enno, it’s about function, not form. Laptops and desktops look the same to the servers.
@Tim, I’ll get to it eventually, I promise. Sorry for the inconvenience. (Does it work at all on an iPhone? It looks small on an Android phone, but can be zoomed in okay. It seems to work okay on iPad.)
> seems I still like commenting on my own posts
From what I see, it’s more like replying to other people’s comments to clarify something, or answer their questions.
I echo the post of Kiwi Nick. Daniel, you do like to respond to other peoples posts, as is good manners from a blog site host. Most of us do like to ask you questions and you do have the good manners to respond, so no wonder you have a high post count.
I guess your post count excludes the opening post to each thread, otherwise there can be no doubt you have a high count.
Having a website or two which I own, I do know something about those list of stats you can get on the users or surfers to a website.
While firefox was my favorite, I now swap mostly between Google chrome and Opera, both on my Windows XP desktop PC. At once, I always used Opera when surfing here, as it had an auto fill for form fields such as name and email etc, but today I am using Chrome, where the form is already filled with my username and nothing else.
I like your interview on 3AW this morning.