In the face of Labor’s proposal for 24-hour trains and trams at weekends, the State Coalition has been talking up its credentials in public transport. This tweet from Acting Public Transport Minister David Hodgett for example:
Only the Coalition can be trusted to deliver better public transport for Victoria: 1,078 extra metro trains &3,870 extra bus trips each week
— David Hodgett MP (@DavidHodgettMP) January 17, 2014
Unfortunately, Services/Trips per week can be a slightly shaky way of measuring public transport provision, partly because consistent information on it is so hard to come by.
And what does it mean? 3,870 extra bus trips sounds like a lot. But what does it represent in percentage terms? And what if those extras are mostly on really short routes?
As it happens, of the trips the Coalition has funded, many are part of the (excellent) Huntingdale to Monash University 601 shuttle, which runs every 4 minutes in term times. Terry K (not M) checked the timetable and counted 1,945 weekly trips (eg half the increase) are on that one route alone. Fantastic for Monash people, and it’s paid off in patronage, but it suggests buses elsewhere may not be doing so well.
A better measure than Trips is Service Kilometres. These are published in the budget papers every year, amongst a huge number of other measures of government performance, so you can compare them year-on-year.
It’s not perfect. An extra train, tram or bus running further is not necessarily useful to people if it runs against the peak flow, or if (particularly buses) are provided on indirect routes running from A to B via most of the known universe. And of course in capacity and speed terms, typically an extra train kilometre provides more than an extra bus or tram kilometre.
But as a raw indicator of how much public transport service is provided, it’s pretty good.
Here’s total metropolitan Service Kilometres since 2001, showing how they’ve done under both Labor (up to 2010) and the Coalition (from 2010).
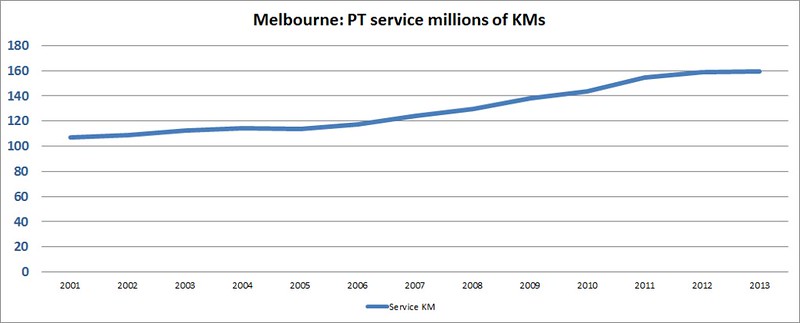
(Note: the figures are for the financial year-ending, and all the 2013 figures in this post are the “expected” result. Others are all the “actual” results.)
What it shows is that in the early Labor years there was little if any increase in services. Around 2006 they finally woke up (as I said the other day, this was when crowding was really starting to bite) and extra services were introduced. This continued under the Coalition until around 2012. In the last year or so, extra service kilometres flat-lined.
This is likely to change when the Regional Rail Project opens, providing extra capacity (which, one hopes, would be used) on the Williamstown/Werribee and Sunbury lines. It’s also worth noting that PTV is slowly reforming the bus network to untangle confusing indirect routes, the resulting efficiency gain being that each kilometre of bus service is getting more useful for passengers.
OK, so what if Service Kilometres was measured against Melbourne’s population? After all, services have to keep up with population growth, otherwise there’ll be trouble.
So I scrabbled around for figures of Melbourne’s population for each year in this range. Basically the population has grown from 3.4 million in 2001 to around 4.2 million in 2013, or 23%.
This gives us public transport service kilometres per head of population.

Once again, this shows that Labor wasn’t setting the world alight in its early years in power, but lifted its game around 2006.
But the growth has slowed under the Coalition, the 2012 and 2013 figures show public transport provision is actually going backwards compared to population growth.
What effect does this have on patronage? When you throw in Passenger Trips (like Service Kilometres, these are also in the budget papers) and divide by population, you can then compare services vs the number of public transport trips per person in each year. This shows us not just the raw number of trips, but whether individuals are actually using PT more.
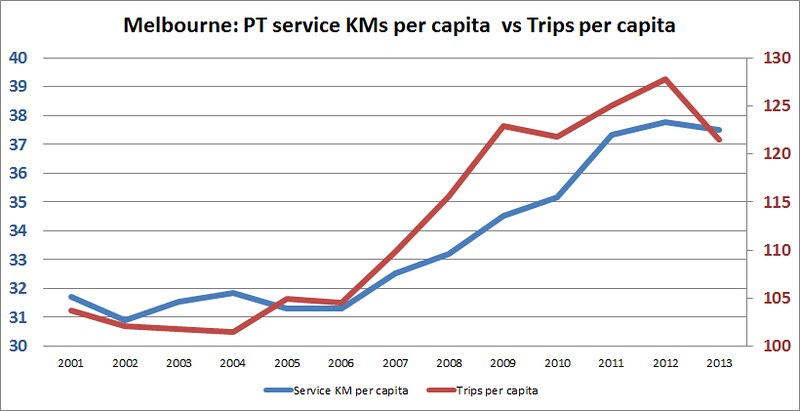
I’m sure there are a lot of different factors, but it’s interesting to see that from 2006 to 2009, trips per person grew at a faster rate than Service Kilometres per capita.
Perhaps apart from issues like urban planning (where people live, work, play — for instance the growth in CBD residents) it also reflects that as you add more services, higher frequencies and better connections mean the network as a whole becomes more useful for more trips.
There was a blip in 2010 (tram patronage fell slightly that year) before growth to 2012… and then it appears to fall strongly backwards. Uh oh. But remember, that 2013 figure is only a prediction.
(See also: PT boardings compared between cities)
Correlation is not causation, but it does seem that if you want to continue to grow public transport patronage — and in any big city, this is a good goal to keep people moving quickly and efficiently, and preferably out of the traffic — you need to keep boosting services.
Perhaps they have something up their sleeves, but unfortunately with the Coalition’s current focus on the East West tunnel, they seem a little too obsessed on road building instead.
It’d be great to see both sides going into the election pledging more services, particularly more frequent services all day, when vehicle and track capacity isn’t a problem.
4 replies on “Service Kilometres Per Capita – are public transport services keeping up with population growth?”
Network size, I say no. The bus network may be catching up after time, but the trams just have not expanded at all and the trains are not keeping up at all either.
We need trains to Bacchus Marsh, Stoney Point, Tooridan, Whittlesea, Yarra Glen, then we may be getting ahead of future housing developments.
Nice work, thanks.
I have little faith in any long term strategy meeting demand. I work in PT…
In the Stonnington Leader it was reported that any Metro Tunnel would have limited benefit for users at Hawksburn, Toorak and South Yarra stations. South Yarar will actually have LESS services if you can believe that.
That might not seem like a big deal for the rest of the state, but consider the amount of new apartment blocks that have been developed and are planned around South Yarra, then consider the approval (Matthew Guy and VCat) of a massive 1,000 apartment tower complex at Orrong Park and it is clear that there is NO collaboration between urban planning and public transport.
Any work is done AFTER the developments have been built, are piecemeal and woefully inadequate.
The irony is, that the inner city dwellers which are ignored because it is assumed they have enough public transport options (despite peak services being completely full, trams and trains) will unfortunately, get in their cars. They may have a slow average speed in that car, but they will have a short journey so its not too much of an inconvenience.
No amount of E-W Link will solve that extra car use, the city will still be logjammed and any benefit to car users from outer suburbs negated.
Speaking of PT matters, I see that Paul Mees got a postumous gong in today’s Australia Day honours. Good on him.
Great analysis. Governments being busy improving PT should be a baseline scenario, not something to be rewarded – if you are not moving forward in a scenario of population growth, you’re going backwards…