Something I’d heard a while back was that some of Melbourne’s busiest tram stops rivalled railway stations for patronage. But I’d never seen any solid data… until now.
Over on the Data Vic page for Department Of Transport, they’ve released not just railway station patronage data (for Metro and also for V/Line), but also tram stop patronage data, and it appears they use a comparable methodology.
The catch? The Yarra Trams stats seem to show patronage by direction, and using ID numbers that can’t be matched up via the public web sites, though you can use the map coordinates. I’ve added those numbers together, so the boardings for tram stops include both directions and are comparable to the station data.
The busiest stops and stations
So then, here are the busiest 25 railway stations and tram stops, using 2018-19 (pre-COVID) data:
| Rank | Mode | Stop_name | Pax_annual | Platforms |
| 1 | Metro | Flinders Street | 28,320,650 | 13 |
| 2 | Metro | Southern Cross | 19,551,450 | 6* |
| 3 | Metro | Melbourne Central | 15,250,700 | 4 |
| 4 | Metro | Parliament | 10,124,200 | 4 |
| 5 | Tram | 13-Federation Square | 9,224,950 | 2 |
| 6 | Tram | 8-Melbourne Central Station | 9,027,550 | 2 |
| 7 | V/Line | Southern Cross | 6,306,000 | 10 |
| 8 | Tram | 11-City Square | 5,955,700 | 2 |
| 9 | Tram | 10-Bourke Street Mall | 5,687,550 | 2 |
| 10 | Metro | Footscray | 5,332,950 | 4* |
| 11 | Tram | 4-Elizabeth/Flinders | 5,189,550 | 2 |
| 12 | Metro | Flagstaff | 4,854,950 | 4 |
| 13 | Tram | 6-Melbourne Town Hall | 4,504,700 | 2 |
| 14 | Metro | South Yarra | 4,367,150 | 6 |
| 15 | Metro | Richmond | 4,227,000 | 10 |
| 16 | Tram | 1-Spencer/Collins | 4,206,350 | 2 |
| 17 | Metro | Caulfield | 4,175,050 | 4 |
| 18 | Metro | Box Hill | 3,685,500 | 3 |
| 19 | Tram | 1-Melbourne University | 2,737,700 | 2 |
| 20 | Metro | Glenferrie | 2,729,100 | 3 |
| 21 | Tram | 1-Flinders Street Railway Station (Robert Risson terminus) | 2,525,750 | 2 |
| 22 | Metro | Dandenong | 2,165,200 | 3 |
| 23 | Metro | Sunshine | 2,157,750 | 2* |
| 24 | Tram | 7-RMIT University | 2,418,700 | 2 |
| 25 | Tram | 6-Swanston/Bourke | 3,184,250 | 2 |
*For some stations I’ve shown only the Metro platforms, as V/Line has their own dedicated platforms. I’ve tweaked some of the stop descriptions for clarity.
So, the fifth busiest “station” is actually the Federation Square tram stops, followed by the stops outside Melbourne Central/State Library.

It’s also interesting to see V/Line in the top ten, a complete change from ten years ago thanks to Regional Rail Link feeding suburban commuters onto their trains.
V/Line’s second-busiest station is Tarneit, very well patronised, though a long way from being in the top 20, with “only” 1.35 million boardings per year.
What about buses? Similar data has been released in the past but does not appear to be currently available. It appears the busiest interchanges such as Monash University’s bus loop got about 6000 boardings per day, but far fewer on weekends, which would put them outside the top 25.
What about DDA compliance? The busiest railway stations that have not been upgraded for compliance are South Yarra (4.4m passengers per year), Richmond (4.2m) and Caulfield (4.2m). For trams, the busiest non-DDA stop is well outside the top 25 at number 21, but most of the busiest stops have non-accessible high floor trams using them.

What conclusions can we draw from all this?
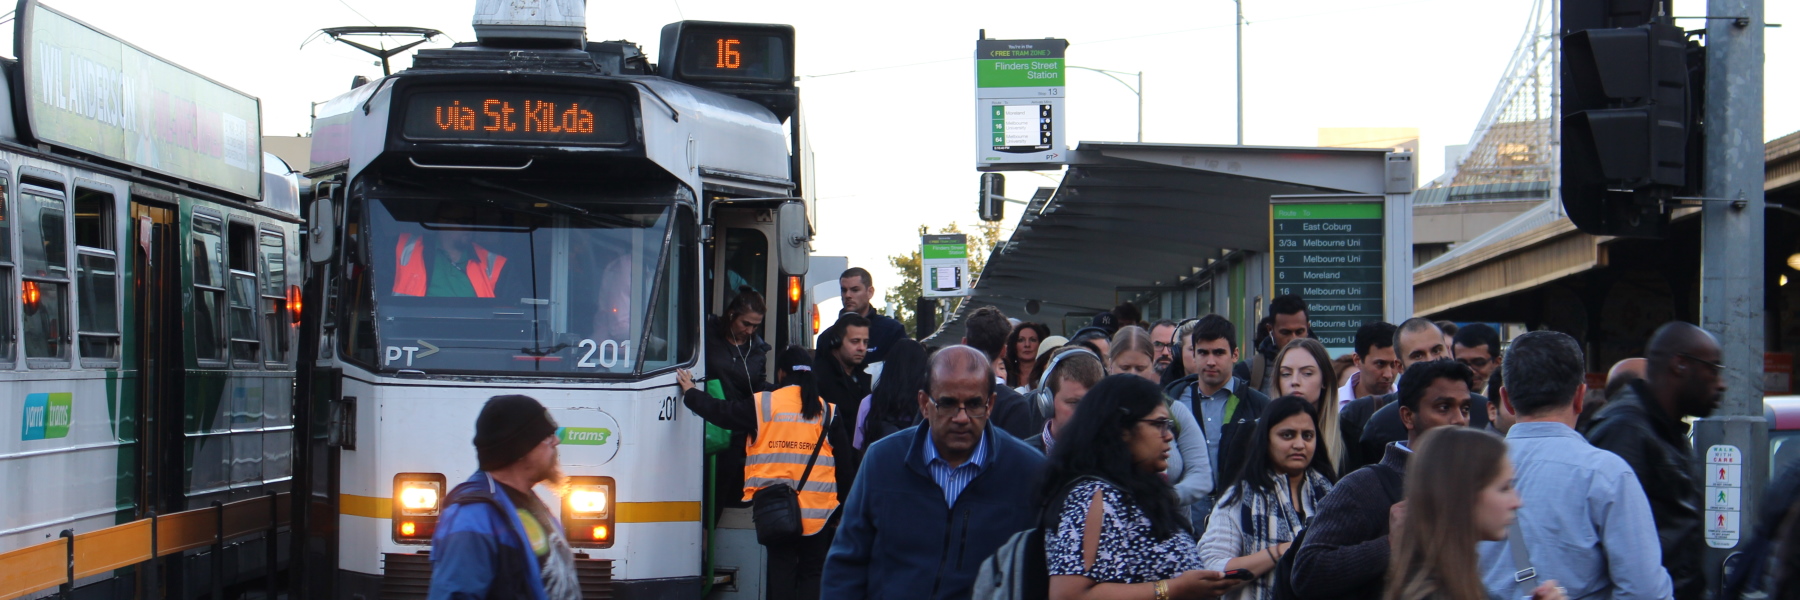
One is that while Melbourne’s tram system may be “iconic” it’s also a top performer in moving people. Four of the top ten “rail” stops in Melbourne are tram stops with just two platforms each.
I find this slightly mind-boggling, and it underscores why mere tram stops need space to cope with crowds (for instance the Federation Square upgrade in mid-2021), and why the trend recently has been towards bigger trams.
More optimisation of the Swanston Street and St Kilda Road would be possible, for instance better tuning of the traffic lights to give trams priority. Tram patronage will change when the metro tunnel opens in 2025, but it’s still worth doing – it will still be an important corridor.
Indeed there’s opportunity right across the tram network for improvements to traffic priority, accessibility access, and minor extensions to improve suburban connections to better balance demand and patronage, to help make it the choice travel mode for around inner Melbourne.
6 replies on “Four of the top ten busiest “rail stations” are tram stops”
Fascinating! Thanks for showing those stats.
One surprise for me is that South Yarra is busier than Richmond. I guess more people travel through Richmond whereas a lot more get on/off at South Yarra.
BTW, the tram stop opposite Fed Sq was absolutely packed on Saturday morning mainly due to Grand Prix fans.
Super interesting stuff. Honestly not too surprising when you consider the frequencies at some of the tram stops, combined with the number of routes and trip generators nearby.
Minor nit pick, but does Flinders Street still technically have 13 platforms? Depends on the classification of 14 I guess. Still, fantastic piece to see how it all stacks up!
Interesting.
Southern Cross – Metro might be under counted and Southern Cross – V/Line might be over counted because (from DOT data description).
“Station entries for Southern Cross station only includes counts of passengers entering the gates to platforms 1 to 8, where regional train services depart.”
For patrons exiting (or entering) SCS at the Bourke Street end, especially coming off (going to) platforms 9-10 and going into the golden mile, it’s easiest to exit/enter through the 2 “V/Line” gates adjacent to Platforms 3-6.
This discrepancy would not be enough to lift Southern Cross – Metro into 1st spot, might it conceivable could drop Southern Cross – V/Line down at least one rank, possibly more.
Which would, of course, further support the argument you are making Daniel.
The tram stop data will be capturing mode change, so Fed Square would capture people interchanging from train to tram at Flinders Street. Whereas people changing trains at Flinders Street would not be counted there (maybe unless they had to touch off and on again within the station complex, which I don’t think you need to do at Flinders Street). And if you changed trams (e.g. went from a Flinders Street tram to a St Kilda Rd tram) your interchange would be counted.
So I think tram travel might be a bit inflated. Having said that, if you made the reverse tram-to-train trip you’d be counted at the start of your train journey too.
@Ben – The highest number platform at Flinders Street Station was 14, but it was recently demoted to ‘Emergency Egress Only – Platform Not In Use’.
https://railgallery.wongm.com/flinders-street-station/F148_6034.jpg.html
With the site of platform 11 occupied with Arbory Bar, that leaves Flinders Street with 12 platforms.
@Roger, I’m pretty sure the stats are based on people entering into stations – Richmond would no doubt be higher if it was people boarding trains (thanks to many changing services there).
@Ben/Marcus – fair points. I pondered platform 14, but eventually went with the number that Wikipedia has.
@Kevin, I wonder if the SoCross figures are kind of balanced out by the V/Line passengers entering the Metro gates to get to platforms 15+16?
@Steve, yes, just as the Fed Square tram numbers count people going train to tram, the Flinders St Station numbers count the many people who (mostly in the afternoon) change from tram to train.
You’re right – numbers at some locations would be affected by having to exit and re-enter to change trains. This affects some people at Caulfield, Camberwell, Sunshine and Footscray, and possibly a few other locations.
—
One additional bit of interesting feedback via Twitter pointed out that you could group all the tram stops at an intersection to compare them with a railway station – eg a “junction” with services going in different directions. I’ll have a go at that in a follow-up post.