How’s everybody going? Managing okay I hope?
How’s the working week going? Well I’m spending it at home.
How was your weekend? Mostly at home.
What did you get up to last night? … I was at home.
It’s been an adjustment, but we’re managing in my family.
Working from home (now in the fourth week) is not, I think, ideal – but is unavoidable at the moment, and I and my colleagues are getting used to that too. Modern technology makes it easier than it once would have been.
Look on the bright side
Overall I get the sense that Australia has handled this well. No doubt we had the advantage of being a bit isolated from and behind some of the other countries, and learnt from them.
After some false starts, near-misses and screw-ups – the Federal and State governments have just about got their act together. This article goes through the timeline of when the wheels finally started turning.
The restrictions for Victoria (for individuals, and for businesses) are having a huge economic impact, but are seemed to be fairly well designed to reduce the rate of transmission, given what is known about it:
[Research found that infection was passed] almost always [by] people with whom they had close and prolonged contact.
… Covid-19 is passed on when coughs and sneezes spray droplets of mucus and spittle onto nearby surfaces. When we touch those surfaces, we may transfer them to our face, allowing the virus to establish infection. This is why we recommend handwashing, avoiding facial touching, coughing or sneezing into your elbow, and keeping a physical separation from others.
Inside Story: So you want to wear a mask in public?
(The whole article is worth reading. It gives me hope that, with a little care, I’m not about to be infected by going to the supermarket.)
It’s funny to think that when the Chinese government locked down Hubei province, some of us thought “well that’s the kind of thing they can do in China – it wouldn’t work here”. A few weeks later we got our own variation.
The restrictions are working
The rules aren’t ideal, and there’s been some confusion. Hardly surprising given how quickly they were introduced.
There are some oddities – they say to only shop for essentials, but many shops selling non-essential goods are open – and you won’t be fined for shopping there. This is tricky though – where do you draw the line around what’s essential and what isn’t?
Overall, despite some issues, the restrictions seem to be working. New cases each day are reducing.
We can be very thankful that the disasters unfolding in the USA, UK, parts of Europe and elsewhere have not eventuated here.
Where to from here?
Even if the infection rates continue to drop off, it’s hard to see all the restrictions being completely removed until there’s a way to ensure it doesn’t result in the virus rapidly spreading again.
For all the talk of herd immunity, the cost of achieving that – large numbers of deaths – is unthinkable. Likewise is an early return to normal activity to get the economy back to normal – making government relief very important.
Even if things are brought under control in Australia, the fact that many parts of the rest of the world have huge problems may mean international travel is not possible for a year or more.
To get completely back to normal, we may have to wait for a vaccine to be tested, verified, mass-produced and administered.
Not that I’m an expert of course. But it seems like this will be a long battle.
Stay well, everyone.
15 replies on “It seems we dodged a bullet”
Long battle it will certainly be. There is a lot of war like talk but it isn’t a war where we can settle our differences, pay what is due and then rebuild. There is not much stopping another strain coming next year and the year after that if we don’t as world improve the way we live and the risk we take to make money and generate a livelihood. We can be a lot more prepared for the next time (as some countries were) but being prepared for the economic shock each time is another thing altogether.
A key thing for Australia is to ensure our neighbours are also advancing their management of this crisis. This is all the small nations around us that don’t have the budgets we have, not the testing capability and the medical systems to cope. Then add the economic impact on top of that.
“I get the sense that Australia has handled this well. ”
I reckon we’ve done extremely well. Full marks to the PM and (at least) the three east coast premiers. They got on with a difficult task rather than squabble or try to score political points.
A good summary of the situation, Daniel. Thank goodness we’re not like the UK.
But we are not using our natural social spacing advantage
Europe has 100 times more population density than us and deaths and cases are x100 too!
NYC has population density a thousand times us and deaths are too (and cases)
OUR strategy needs to be based on OUR risk probabilities, backed up by our very proven triage system to find the bug
THAT was NOT THERE 8 weeks ago
Nor the blocks on the big risks, travel and mass-events
So the assembly of risks and probabilities is a tiny fraction of where we were in Feb/Mar
I’m don’t think density alone explains the different results. NYC might be the worst in the USA, but the whole country has problems.
For instance looking at a big US city of about Melbourne’s size: Greater Boston. Population 4.8 million, metro area 11,700 sq km = 410 people per sq km.
Greater Melbourne population 5.08 million, metro area 9,993 sq km = density 508 people per sq km.
Boston has had 7,910 confirmed cases, and 271 deaths.
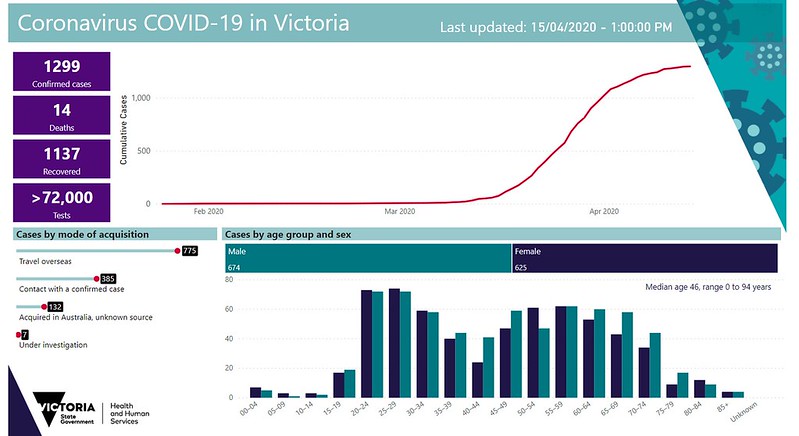
Melbourne has had 1,092 confirmed cases. The DHHS figures don’t provide a Melbourne-only figure for deaths, but it’s 16 in the entire state.
But elsewhere in USA it is as “safe” as Australia
Utah, Texas, Wyoming, Hawaii, Alaska even California has 45 deaths per million (NYC is above 1000)
Obviously “other factors” apply but the principal driver by far is population density
In the case of Boston maybe it is closeness to the NY epicentre
UK has PD greater than France/Italy/Spain and will inevitably get around 600 deaths per mil (double present rate)
Like Belgium that has 622 deaths/mil and similar PD to the UK
Analysis of 70 countries and 50 US States shows a clear relationship to Population Density
The second driver is “Propensity to die” for each country
There is a measured index (CDR) that tells us how many people will die in that country per 1000..in a year
Australia is 7, World is 8, Europe generally is 9 and Italy 11
So Italians are statistically 11/7 = 57% more likely to die in 2020 than Australians
This is not a “racist” matter : more to do with babies v oldies, lifestyle, health, hardship even war
Middle East is 5
The CDR for Katherine NT is 14 and North Shore Syd is 6
The simple maths for Cases per mil is Pop Density x 20 + 200
And for deaths per mil is Pop Density x 1
Then apply the CDR factor to get a “ballpark” figure that can then be adjusted for “other factors”
This is derived from six weeks working daily on the REAL World data
@David, if you’re going to throw lots of numbers in like that, could you cite your sources? Whose analysis? Got a link?
Comparing some of the US states you mentioned (using figures from the Google dashboards that come up in the search results):
Texas. Population 28 million. Confirmed cases 25,297. Deaths 663 (23.68 per million)
Utah. Population 3.2 million. Cases 4,233. Deaths 41 (12.81 per million)
Alaska. Population 0.73 million. Cases 345. Deaths 9. (12.33 per million)
Wyoming. Population 0.58 million. Cases 7. (12.07 per million)
California. Population 39.5 million. Cases 43,464. Deaths 1,755 (44.43 per million)
Australia. Population 25 million. Confirmed cases 6,738. Deaths 88 (3.52 per million)
NSW is perhaps the worst affected state in Australia. Population 7.54 million. Confirmed cases 3,016. Deaths 41 (5.43 per million)
So even if you look at the USA excluding the dense northeast hotspots, the numbers don’t look good compared to Australia.
Daniel, you are using Population NOT Population DENSITY
PD is Population in millions divided by Area in Mil SqKm
(and be careful, because a lot of US data is in square MILES)
Do your sums again with PD
It is NOT an accurate method, but the relationship is “similar”
It certainly “explains” why our Deaths/mil are 3 and PD is 3 people per sqkm
Yet the SAME bug gets 350 to 600 deaths/mil in Europe where PD is 100-500 people per sqkm
To do the thing properly you need to adjust for the propensity to die (the CDR ratio) and you need to figure out the “final” deaths mid 2020
But in the generality PD is “similar” to Deaths per million
The PD remains constant but the deaths are rising daily, so it is in part a moving target
The Australian by-State analysis is mucked up by the 18 imported deaths
For the 50 US States
LOW PD 64 deaths 104 peo per sqkm
MED PD 102 deaths 247 peo per sqkm
HIGH PD 235 deaths 490 peo per sqkm
For NYC (Queens, Bronx, Kings, and NJ ) the pop density is 10,000plus per sqkm and deaths currently 1100/mil rising to probably 1600 per mil
It works fairly well in Australia for Cases, if you regard the PD of ACT as being the same as NSW
Per million pop Cases by formula
NSW 372 400
VIC 205 755
QLD 203 255
SA 250 234
WA 210 220
TAS 412 318
ACT 248 400
NT 110 203
AUSTRALIA 266 263
The Cases formula is 20x PD plus 200
It doesn’t work for VIC
But it certainly “explains” why European countries with PDs 100 times ours have “cases/mil that are 100 times ours
For the SAME bug
And why New York State has 15,000 cases per mil yet we have 266
And Europe has 2000-5000 cases per mil
Got a link to an actual study David?
Here’s a chart comparing COVID-19 death rates with population density. Even if you discount Africa due to reporting difficulties, it’s difficult to discern a pattern. Some countries like Canada and Iceland which don’t have high density overall, sadly have a large number of deaths: https://ourworldindata.org/grapher/covid-19-death-rate-vs-population-density
Of course one needs to be cautious of country-wide numbers, the same reason it’s perilous to lump in “Europe” as one entity. Canada has dense population centres.
Indeed, so does Australia. Data from 2019 says central Melbourne has a population of 179,000 within an area of 37 square kilometres = 4837 people per square kilometre, and I’m sure it would be higher within the Hoddle Grid.
Some more reading:
Scientific American: Are Crowded Cities the Reason for the COVID-19 Pandemic?
World Bank: Urban Density Is Not an Enemy in the Coronavirus Fight: Evidence from China
Citylab: The Geography of Coronavirus
I’d hesitate to jump to any conclusions just yet – in part because I’m not an expert in disease, and in part because this is still playing out.
But I would still argue that it’s government response that is the main factor here, not city density.
I agree with quite a lot of your comments
But at the core, do you really think our “Govt policy” has been 350 times “better” than NYC?
Or 150 times “better” than Italy
Or 200 times “better” than Belgium or UK?
How do you quantify the 1100 deaths per million in one place v 3 per million here…….from the same bug and the same “tests for cases needing help”
It works especially well for the 50 States of USA
There is a very clear relationship between Population density and Cases per mil pop….. and Deaths per mil Pop
For Deaths per mil use …. DPM = 6.5 times Pop Density + 13
It is a very clear empirical relationship
And a clear empirical relationship between cases/mil and deaths/mil
Cases per mil = DPM x 12 plus 1000
If you need it expressed simply
* If PD is about 180 then deaths are about 1000 dpm
* If PD is about 65 then dpm is 450
* If PD is 35 then deaths/mil are about 185
* If PD is about 20 then dpm is still about 185
* If PD is about 10 then dpm is 90
* if PD is about 8 it is 60 dpm
* If PD is about 6 it is 50 dpm
* If PD is about 3 it is 30 dpm
* If PD is about 1 it is 18 dpm
I think you’d agree a STRONG relationship between PD and deaths per million
AND between PD and Cases per million
@David, your last two lengthy comments on this removed. Enough.
Get yourself a blog and I’ll happily link to it from here.
It would be really great if we could find a cure.
We have been very lucky in deed. If it was not for the WHO, and China, we may have never had a death.
@Jim, spare us the conspiracy theory rubbish please.