A follow-up to last week’s post mapping out the number of train services per station.
Commenter Andrew suggested I compare it against patronage – happily I’d been working on this anyway!
Here it is – and as a bonus I’ve got hold of 2017-18 station patronage data.
The darker the blue, the higher the boardings per service. Click on a station to see the numbers.
What’s interesting is that the top ten stations for boardings per service are not what you might expect.
- Melbourne Central 51.060
- Sunshine 46.142
- Southern Cross 45.337
- Box Hill 44.133
- Flinders Street 42.08
- Williams Landing 41.522
- Watergardens 39.459
- Footscray 39.360
- Essendon 38.933
Remember, these are figures across the entire day. Peak would be a lot busier.
I was surprised that two of the top five are well outside the CBD. And if you’re boarding at Williams Landing or Watergardens and you think it’s busy, it’s not your imagination.
Is it an anti-west bias? I wouldn’t jump to that conclusion. Historically, development in Melbourne has spread further to the east and south than the west and north. So the train lines are longer, with more stations, and thus overall higher patronage. So more train services are needed.
Of course the north and west are now growing fast. Is provision of PT keeping up with demand? Nope… but that’s the case across most of the city.
Charting the numbers
Here is the data on a chart – services per weekday on the X axis, and boardings on the Y axis.
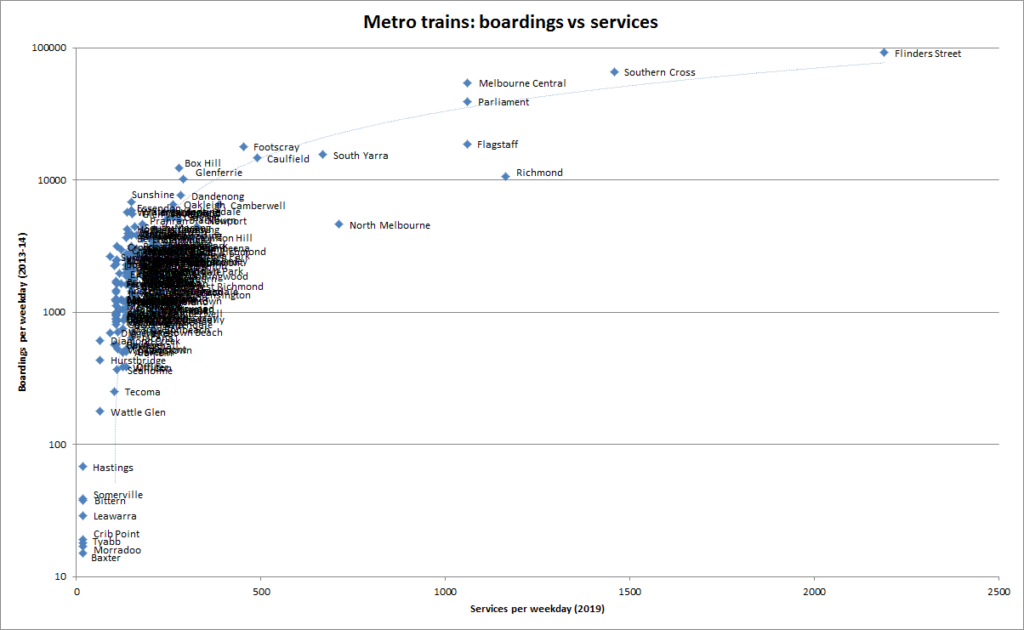
Note the patronage (Y axis) is on a logarithmic scale. It was even messier without this, because just a handful of stations have daily boardings up between 10,000 and 100,000 per day.
The middle range, between 500 and 10,000 per day is a bit of a dogs breakfast because of a large number of suburban stations in that range – and in many cases, they also have identical service levels, thanks to being on the same line. More on these below.
Broadly, you can see that the higher the patronage, the more services a station probably gets.
But does patronage follow service, or service follow patronage? A little of both – authorities tend to try and respond to demand/crowding, but the convenience of frequent services attracts more passengers (including more development around stations – hello South Yarra!)
The underground stations at Parliament and Melbourne Central (and to a lesser extent Flagstaff) get a lot of people going through them, despite only having four platforms and about half the number of train services as Flinders Street.
The highest ranked Zone 2 station is Box Hill, followed by Dandenong. Some zone 2 stations have seen a big increase in passenger numbers since the fare cap was introduced in 2015.
Zooming in on the suburban stations of under 7000 boardings per day, things become a little less muddled:
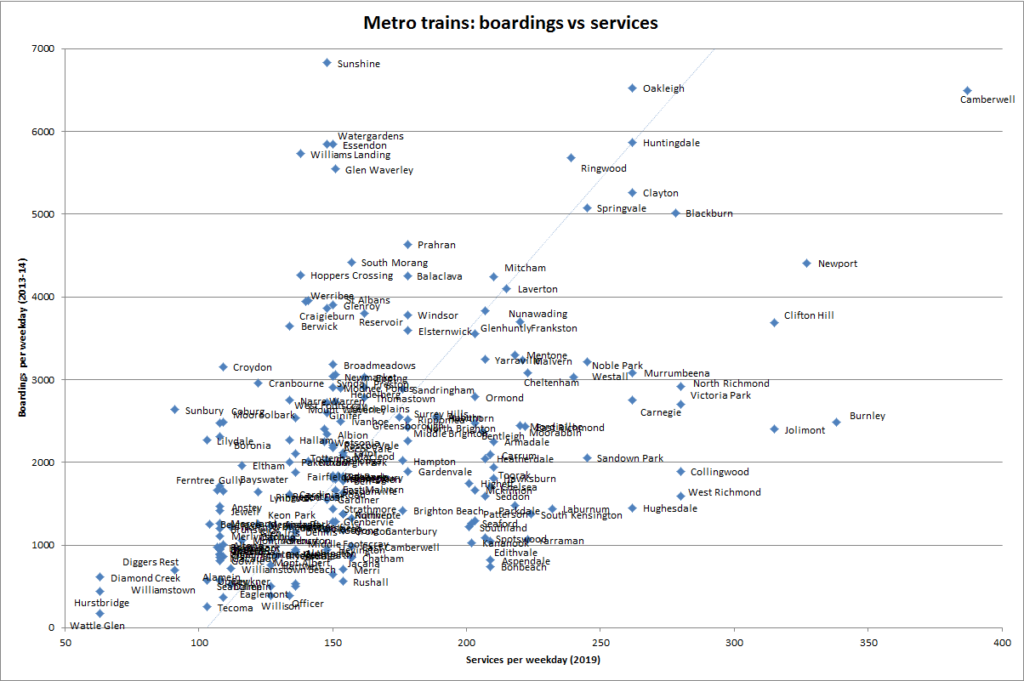
A few stations like Newport, Camberwell, Clifton Hill and Burnley are getting more trains than you might expect for the patronage, thanks to their junction status. They are important for interchange, and different lines converge there, resulting in more services. (In contrast, Caulfield gets slightly more services, but has the patronage to match thanks to the adjacent university campus.)
Some inner-city stations also get more services than the patronage might suggest – but this certainly is not an argument to cut services – one could expect recent infill development has seen the numbers of passengers continue to increase in recent years. Consistent stopping patterns are also important – running some trains express burns up track capacity and creates confusion.
There are also some very busy middle and outer suburban stations that appear not to be getting enough services, such as Sunshine, Essendon, Glen Waverley, Watergardens, Werribee and Hoppers Crossing.
This Channel 9 story in February (which is where the patronage data came from) highlighted the mismatch between demand and supply:
Regulars here would know my message from all this: as Melbourne grows, so does overall travel demand. The number of services provided around the rail network needs to continue to grow, including outside peak hours – as well as boosting tram and bus services.
- See more on the Channel 9 patronage story from February
- Patronage in 2017-18 at some stations was affected by major works, for instance Rosanna (and surrounding stations), the Dandenong line and Frankston all had closures.
- Projects such as the metro tunnel will enable increased train services on many lines, but the timing and number of these is unclear.
- I’ve been reminded that Philip Mallis posted a different set of data, showing annual patronage at stations, including both V/Line and Metro.
17 replies on “Train services vs patronage”
The numbers are somewhat skewed by station spacing. Where stations are distant (Werribee, Hoppers, Williams Landing) the numbers are big. Where they are close (eg Edithvale – Carrum) they are low (helped by the frequent service). Would it be possible to do a boardings per line kilometre on various segments of the network to neutralise this?
Then compare with with a service intensity measure on the same segments to identify the underserved segments (most obviously Footscray – Watergardens) and the relatively more serviced parts (Eltham – Hurstbridge)?
The next challenge will be trying to represent the ‘fullness’ of services along their journey, and identify the station after which a service is likely to be too full to practically enable further boardings. I expect there would be some stations that have frequent services, and boardings would be higher, but for the learned knowledge that it’s often hard to board at those stations due to services being full, so people don’t go there.
G’day.
I’d be curious to see how many boardings non wired metro stations get, such as Melton, Tarneit and Wallan get. Considering how many less services they have access to. I know a lot of people from Whittlsea and parts of Mernda/ Doreen come across to Donnybrook and Wallan to catch trains into Melbourne.
What’s depressing here is actually how low the patronage numbers are.
If you told a transport planner in another major city that we had stations that had just 20 passengers per service, then they’d probably recommend downgrading the frequency!
“You mean you are stopping a train that can hold a thousand people for just 20 passengers? Why don’t you replace it with a bus?”
So lots of room to grow patronage in the off-peak to get these numbers higher!
Would it be easy to combine patronage for stations along the same line vs. how many 10-minute-frequency minute bus services and tram services stop at that station?
Great job again! I’m just curious, where is the full set of data located? The Channel 9 article only seems to have from Flinders St to Blackburn.
There are a few counter peak untimetabled services that run Sunbury Watergardens St Albans Sunshine Footscray which might soften the extreme values slightly.
Good suggestions for slicing the dicing the various data a bit more – though my list of ideas is getting ever longer!
@Damien, GTFS includes all modes, but the patronage data only includes Metro unfortunately.
@Felix, I don’t think it’s online. I’ll see if I can get it all posted soon.
Looks like the Altona loop patronage has stagnated since 2014. Not surprising, given the poor service but there has been substantial residential infill growth since that time. Explains the full car park at Newport on weekdays (maybe, I don’t think there is any actual data).
Is the patronage data you have, divided into time bands?
As of a decade ago, the busiest 15-minute slice of city arrivals (peak-of-peak) represented 18.97% of the total two-hour AMP, and 8.70% of the daily total. But that only applies to the five CBD stations, so data on the rest of the system would be interesting.
@Damien, an update: data posted by Philip Mallis does include V/Line, but it’s annual patronage. All the same, I’ll see if I can do a follow-up map matching that up to the timetable data. https://philipmallis.com/blog/2019/02/14/station-patronage-in-victoria-2013-2018/
@David, no, but I believe somewhere out there is a set of data showing anonymised Myki touch-ons including exact times.
I don’t think anyone who’s actually taken a peak hour train to Werribee would be surprised by how busy Williams Landing is. People go out of their way to sit at either end of the train (where the ramp and stairs start), and start moving towards the doors when the train gets to Aircraft.
The station is not big enough to handle its current patronage. It takes several minutes to get from the train out to the concourse if you get stuck behind the crowd going up the stairs or ramp.
This doesn’t count passengers who transfer without a tag-off/tag-on. I was recently on a city-bound evening peak train from Broadmeadows, which was quite full by the time it arrived at Southern Cross. I was surprised when well over half the passengers alighted to transfer to other services.
Data for some stations needs adjustment for construction activities, for example Hughesdale was closed for most of the 2017/18 period and opened again 25 Aug 2018, while Southland was not opened until 26 November 2017, almost half-way into the reporting period.
I think it’s very telling that Tarneit and Williams Landing are at the top of the tables for metro and V/Line and are within a few kilometres of each other.
Also Williams Landing got a lot busier after it became zone 1
It would be really interesting to keep an eye on this data as population density increases near some stations. For example – a number of residential towers in Moonee Ponds have just been completed, and three more will be completed in the next year. All are close to the railway station, and I’d expect boardings at Moonee Ponds to increase in the next round of figures.
Regarding Newmarket (my station) – we are already at the point in the morning peak where if there is a delay of more than two or three minutes or worse, a cancelled service, then some passengers will not be able to board. Some people I know have changed to getting the 59 or 57 tram in the morning, and train home in the evening.
If the Upfield line had a 10-minute frequency I’d strongly consider the longer walk to Flemington Bridge, but until that line gets fully duplicated I guess there’ll be no frequency increases.
“Projects such as the metro tunnel will enable increased train services on many lines”
We’ll see. Services on the Cranbourne line won’t change at all until the line is fully duplicated from Dandenong to Cranbourne.
[…] Previous map: Services vs patronage […]