Updated public transport patronage data has just been released, including for January 2026. This is particularly interesting given the Summer Start free weekend travel that applied during December and January.
Unfortunately the other data set that separates out patronage by days does not include weekend data for this period. It’s not clear if this is due to the free travel meaning Myki data isn’t available, or just a delay because they will try to tally it up from other sources. I might come back to that in a later post if an update emerges.
For now we’ll have to confine ourselves to the monthly data – which always moves up and down a bit due to different numbers of days (and weekdays) in each month – and different alignment of weekdays to months each year.
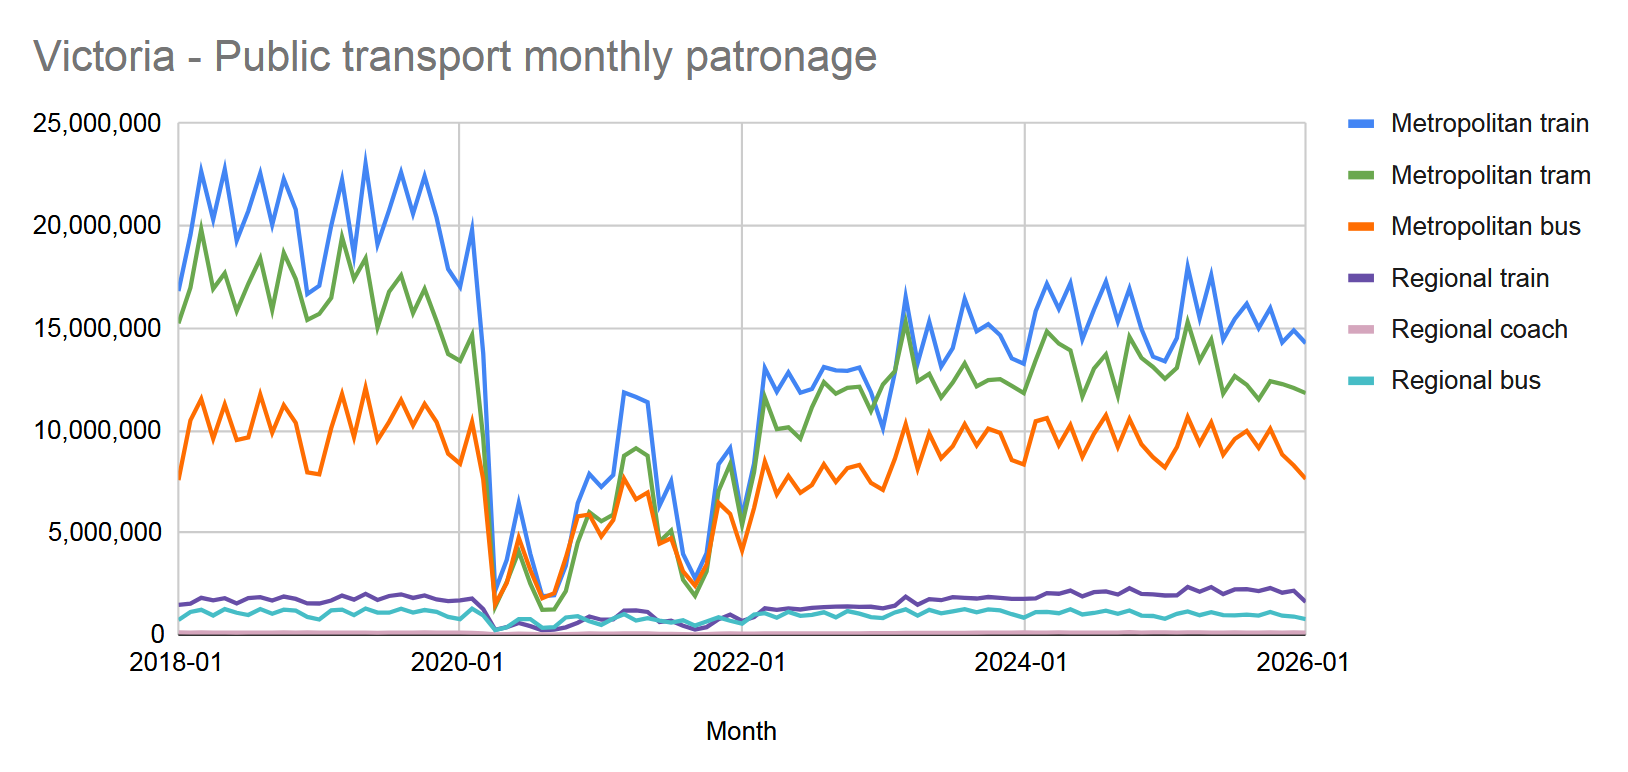
First, big picture. We know this story. Things were bubbling along nicely until 2020, when patronage fell away. It’s gradually coming back, but with changed travel patterns, probably won’t get back to 2019 levels any time soon, even with population growth.
Some observations:
- The numbers are up and down a bit each month. Some of it may be attributable to different numbers of weekdays, some to other factors such as major disruptions due to planned works.
- Since early 2022 patronage has been growing back
- Noticeable dip in early 2025, more or less in line with the usual January quiet period, but last year it extended into February
- Apart from that, at a high level the post-COVID growth may have levelled out since 2024?
For 2025 (including the Summer Start period), in the following two charts I’ve compared patronage each month to that of the previous year.
Given the data includes January 2026, I’ve gone one month either side of the calendar year, so it’s Dec 2024 to Jan 2026.
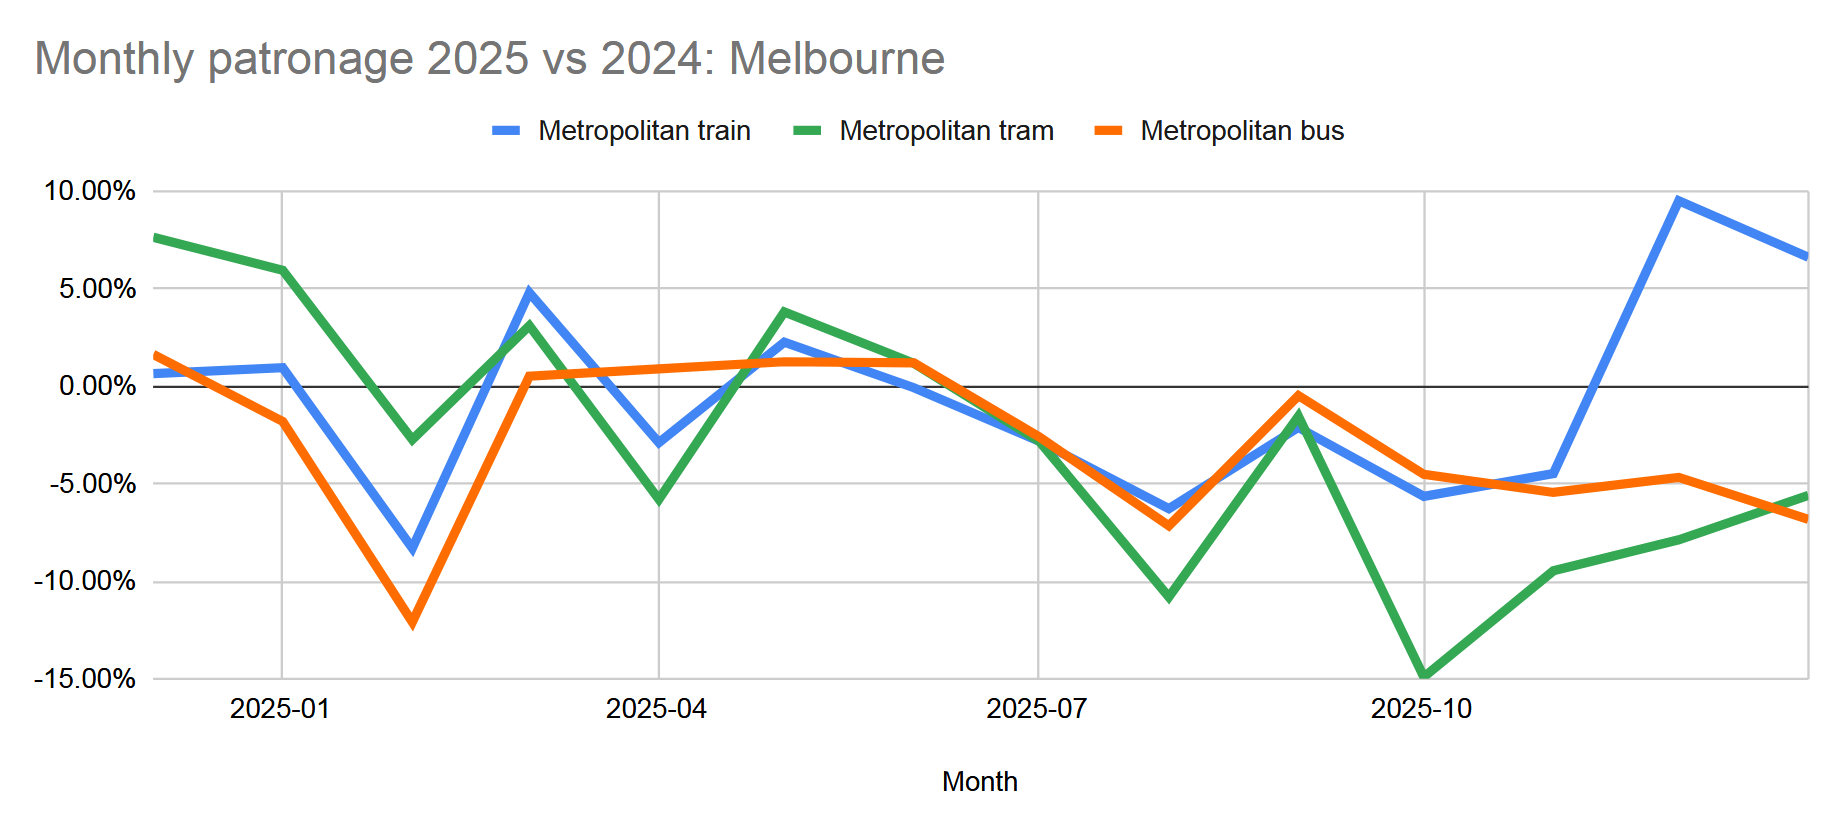
Here’s Melbourne metropolitan services (excluding V/Line suburban services, which are in the following chart).
What’s noticeable here:
- A noticeable dip in February 2025 vs 2024. 2024 was a leap year with 21 weekdays, and 2025 wasn’t, with 20. But bus being 12% lower and train 8% does seem odd – and as shown in the first chart, it was definitely a quiet month. There were some major rail works which may have contributed.
- October 2025 tram patronage was 15% lower than 2024, which is quite the variation. Major works for most of the month disrupting all Elizabeth Street routes would have contributed.
- The final two points on the right are December 2025 and January 2026, the Summer Start, with free weekend travel as the State Government encouraged people to explore the Metro Tunnel. Rail patronage took off… but tram and bus didn’t.
Here’s regional:
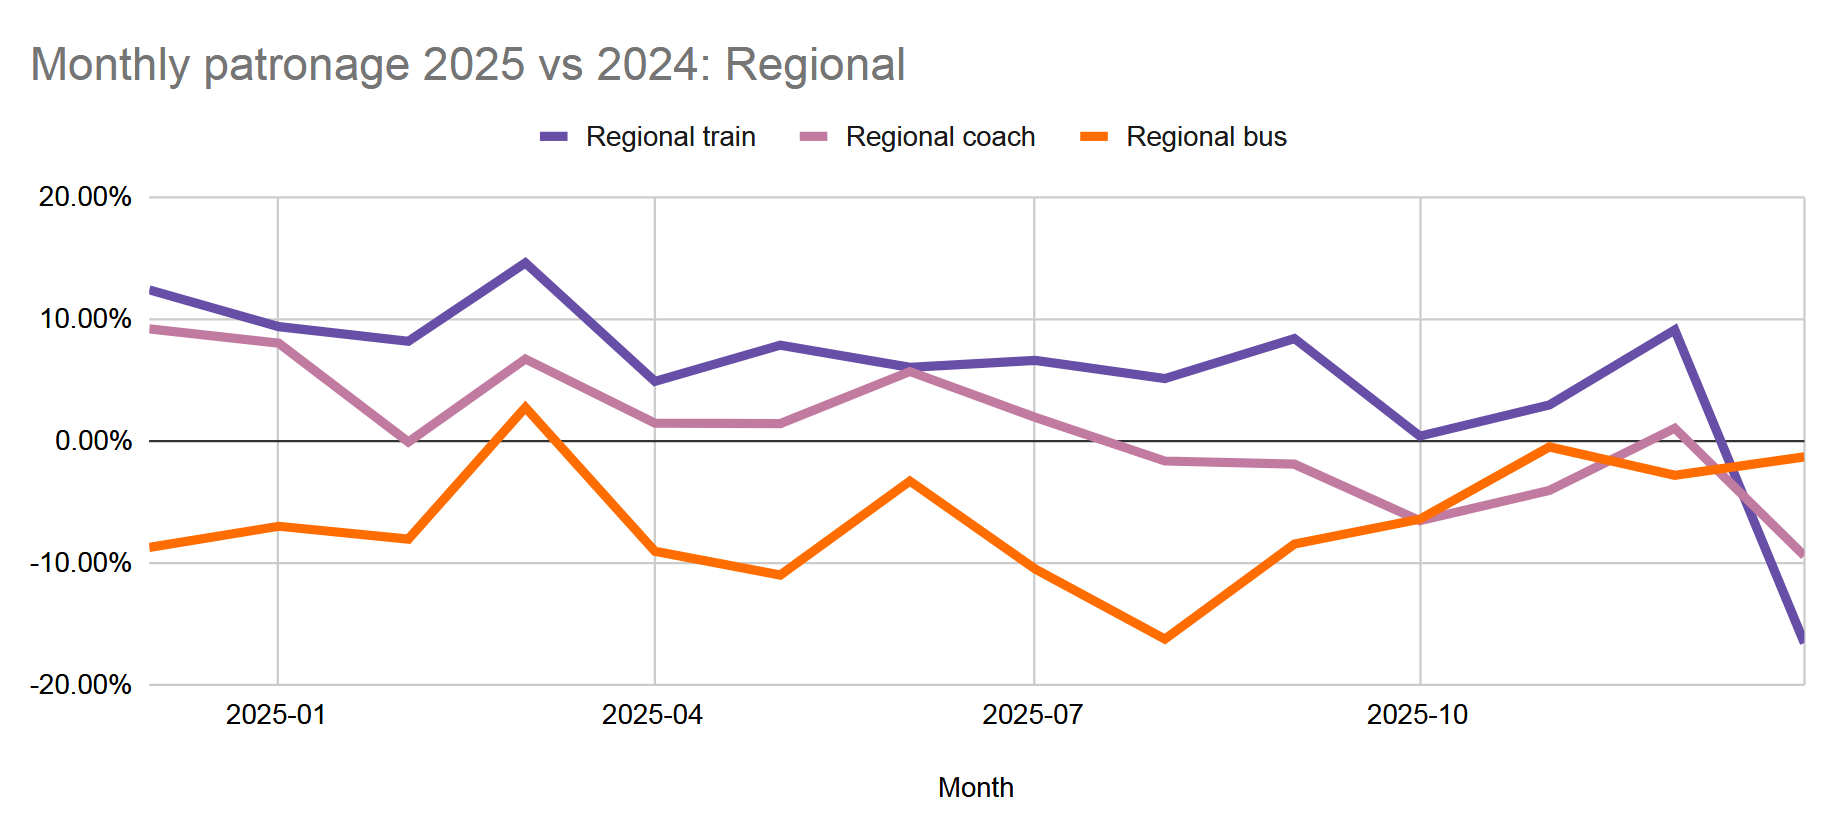
- Again, some variation here, but regional (town) buses were mostly down in 2025 vs 2024
- Patronage on trains and coaches higher through 2025 than in 2024 may have been the ongoing patronage growth following the V/Line fare cut in March 2023
- (V/Line trains for CY 2025: 25.7m; 2024: 24.1m; 2023: 20.3m)
- And regional trains unsurprisingly had more patronage in December 2025 when weekend fares were free
- But regional trains and coaches took a dive in January 2026, due to extensive service closures and travel restrictions from extensive fires through much of Victoria
I’m still hoping the weekend data for December and January is released so we can more clearly see the effects of free weekend fares.
In the meantime, maybe some of you have better memories than me and can point to specific events that might have influenced this data. What else can you see here?
Source: