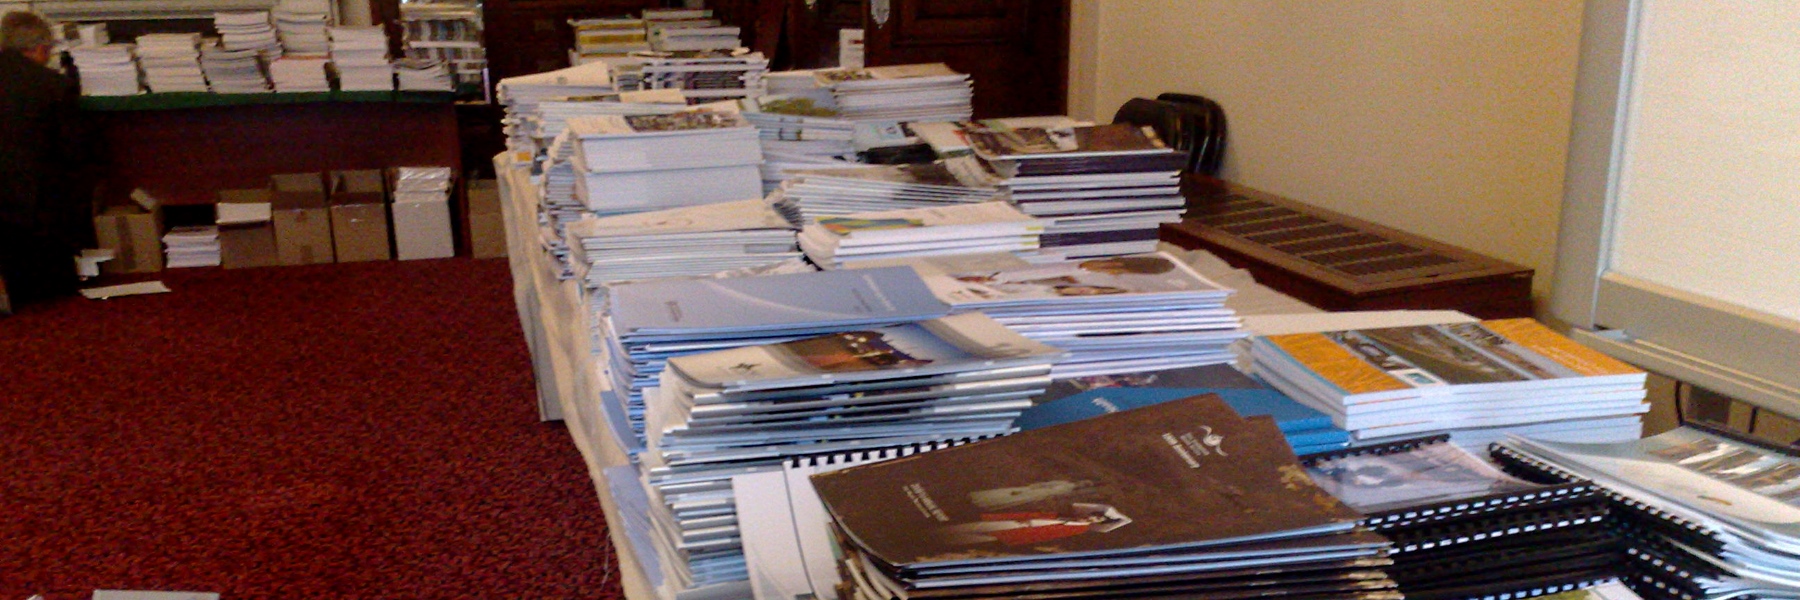
State government annual reports season ended up hitting late this year due to the election.
It’s usually in September, but this year everything got tabled in Parliament late on Wednesday.
I usually like to browse through the V/Line and PTV reports for interesting factoids…
Here are some things I noticed during a quick skim.
V/Line annual report 2017-2018
20.8 million trips, up about 1.5 million in a year. No wonder the trains are crowded. All of the increase is on rail; coach trips are slightly down to 1.3 million, and account for only about 6% of all trips.
They sold 2 million paper tickets (used for coaches and trains outside the Myki area), so that might mean that around 90% of V/Line trips are on Myki, though some paper tickets would presumably cover multiple (eg return) trips.
Compensation paid doubled to $157K – and that’s “compulsory compensation”, so presumably not voluntarily, but related to ongoing (worsening?) poor performance.
Farebox is up to $102m, but full fares are down 5% to 62%. The subsidy per passenger increased slightly to $23.93
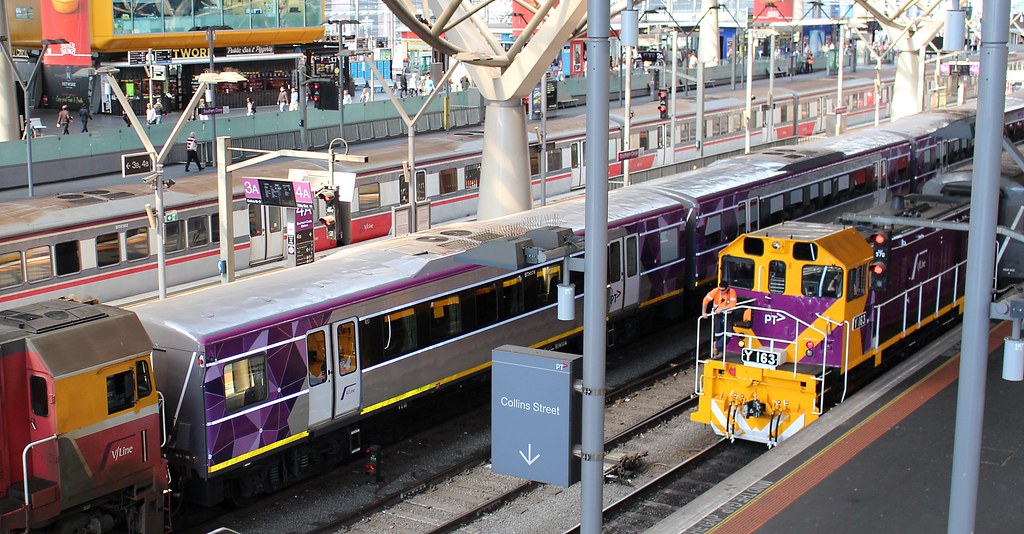
V/Locity carriages increased by 27 as locomotives decreased by 10 – apart from newer trains being hopefully more reliable, the move to Diesel Multiple Units (DMUs) over time should help cut costs, as there’s none of the messy shunting the loco when terminating each service
Geelong line patronage up an amazing 115% in the past 4 years
Trespasser incidents up from 589 to 908, but this is attributed to better reporting rather than increased occurrences
It’s interesting to read the summary of staff numbers. Out of 1915 Full-Time Equivalents), the frontliners are: 301 station staff, 289 conductors, 379 train drivers, and just 9 Authorised Officers
PTV annual report 2017-2018
Metropolitan trips 565 million for 4.8 million population… I make that 117.7 trips per person per year
Regional trips 33.3 million for 1.5 million = 22.2 trips per person per year; perhaps no surprise that it’s lower, but it makes me think a lot more needs to be done to improve regional town services, where public transport can compete more against car trips.
Metropolitan services fare recovery 30%
… but total fare receipts are on the rise: 2018 $917m, 2017 $871m, 2016 $814m, 2015 $845m, 2014 $806m, 2013 $604m. (Next time some bright spark suggests making public transport free, ask them where the $917m in revenue will come from instead if there are no fares.)
Payments to operators of $1.4b to MTM (Metro), $0.3b to KDR (Yarra Trams), $2b for the dodgy state government Capital Assets Charge for rail infrastructure (there’s no equivalent road charge) and $1b for bus services.
(As I understand it, MTM and KDR also get 40% each of the metropolitan fare revenue, so it appears to mean the trams come close to breaking even, despite all the Free Tram Zone free rides.)
Nothing in the reports leapt out at me as a gotcha reveal, but things are so busy that I’ve only had time to skim.
And among the other 115 reports released on Wednesday, the VicTrack report is also out… I haven’t read that yet.
Anybody else spot anything interesting?


7 replies on “A quick skim of the Annual reports”
Thanks Daniel. It looks like we can finally say public transport in Melbourne is setting records for patronage, having surpassed the immediate postwar level of around 530 to 550 million trips per year. What’s disappointing is the figures don’t provide any breakdown in revenue attributable to metro and regional transport, and don’t separate out the payments to operators other than in that introductory note.
Yarra Trams now I think gets 30% of fare revenue, though I have no idea whether that’s total Myki revenue or just that part attributable to metro services (however that might be calculated, if at all). Fare recovery has always been much closer to the break-even level for trams than other modes of transport when the revenue and costs are attributed reasonably, so it’s not surprising this should continue to be the case. Trams set the example for the rest of the system once again.
@Tony, actually I have some stats on patronage since WW2, and compared to now. Will post that next.
I get the feeling they’re aiming rather low for the Customer satisfaction index. 77% has that near enough is good enough attitude about it. They should be aiming for 90% plus.
“Next time some bright spark suggests making public transport free, ask them where the $917m in revenue will come from instead if there are no fares.”
Taxes. Perhaps on businesses since they benefit the most in terms of the productivity gains from a larger labour force made available by PT, and less congested road freight.
I just found out that USA is getting an elevated railway with 21 stations!
https://www.citylab.com/transportation/2018/01/why-its-so-expensive-to-build-urban-rail-in-the-us/551408/
That makes me wonder if the opposition to elevated railways in Victoria has finally disappeared. Could the Monash Uni station be elevated? Could the Waverley Park station be elevated?
The skyrail in Vic was a pleasant surprise to me because I thought Aussies will oppose it due to its elevated design – but Dan Andrews won the election again!
Time to do a poll on whether or not Victorians are ok with elevated railways now.
Interesting statistics regarding the relative subsidy of trams v buses. I assume this doesn’t include capital costs of new trams? The accepted wisdom seems to be that new light rail has a poor cbr, but the Melbourne experience of improved amenity driving increased patronage which seems to be lowering per ride subsidy would be a great topic to explore in a future post.
No wonder the Geelong line is popular ! It is so fast ! I just travelled on it for the first time in decades. A choice of seven or so stations in Geelong also makes it quite accessible to users.
There are some quirks, though. Try being a visitor from somewhere not Melbourne, and going to Southern Cross station, and scrutinising the visible information there, and trying to find the train to Geelong.